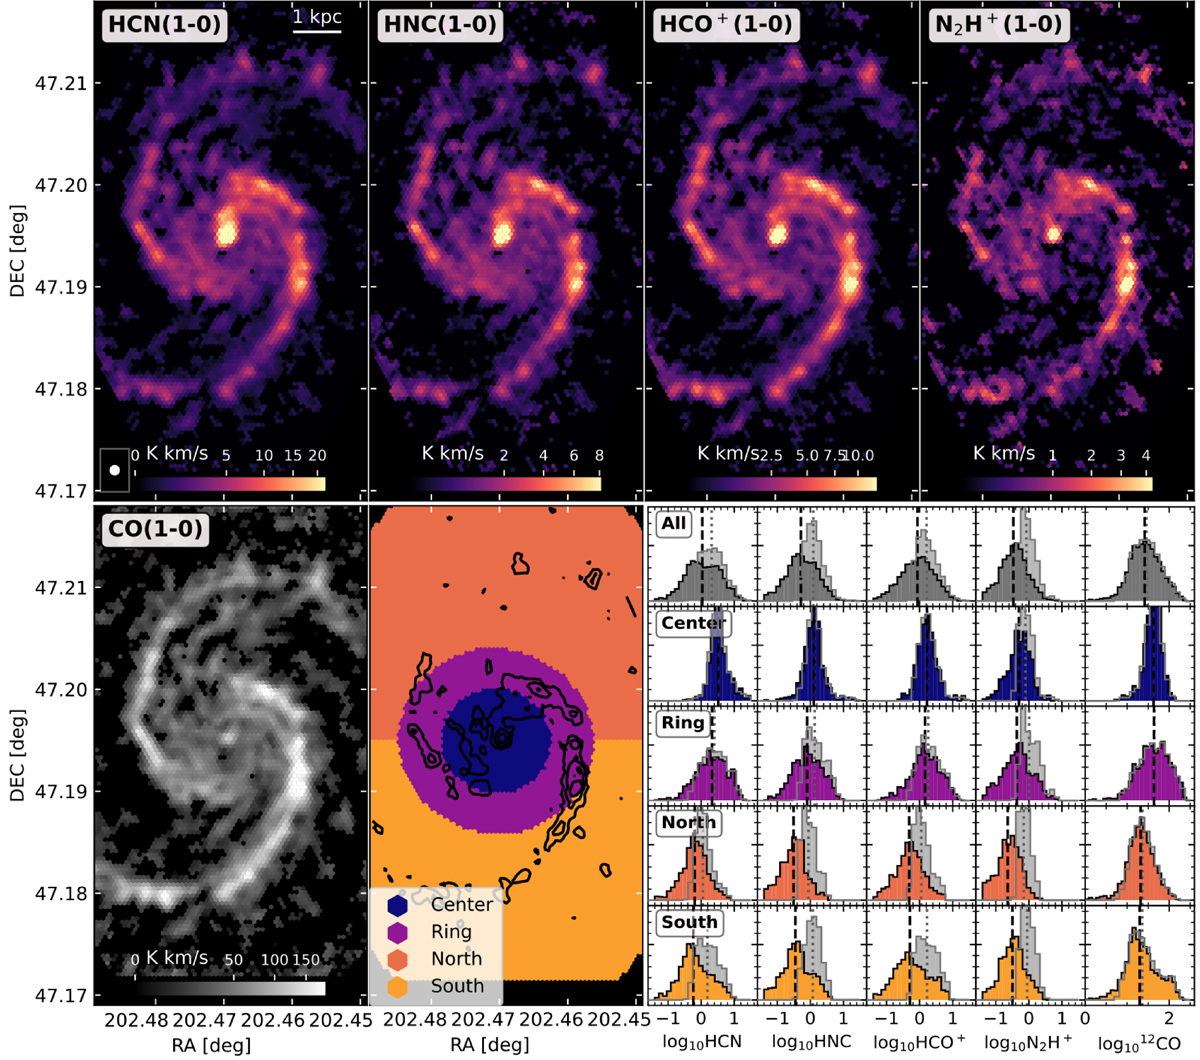
Fig. 1.
Download original image
Integrated intensity maps of dense gas tracers HCN, HNC, HCO+, and N2H+ from SWAN at a common resolution of 3″ (top row from left to right), as well as from 12CO (PAWS, bottom left). We divide the disk into a center and ring environment (Colombo et al. 2014a), and the outer disk into northern and southern halves (bottom row, second panel from left). We add contours of integrated N2H+ emission of 0.75, 2, and 4 K km/s to the environment map. We show the pixel-based integrated intensity distribution (in Kelvin kilometer per seconds) in various environments in the disk for all pixels in the FoV (colored shaded area), as well as for pixels where emission is detected (emission > 3σ, light gray shaded area) in the bottom right panels. The area of each histogram is normalized to unity. We indicate the median of all pixels (black dashed line) and median of masked pixels (dotted gray line) of each environment. The median represents the median value of logarithmic emission (med(log10(I))). Pixels with negative emission are excluded in the logarithmic scaling of the histograms. Since CO is detected across most of the FoV and is used as a prior in the creation of the moment-0 map (Sect. 2.2), its masked histogram distribution agrees well with the unmasked one.
Current usage metrics show cumulative count of Article Views (full-text article views including HTML views, PDF and ePub downloads, according to the available data) and Abstracts Views on Vision4Press platform.
Data correspond to usage on the plateform after 2015. The current usage metrics is available 48-96 hours after online publication and is updated daily on week days.
Initial download of the metrics may take a while.