Fig. 15.
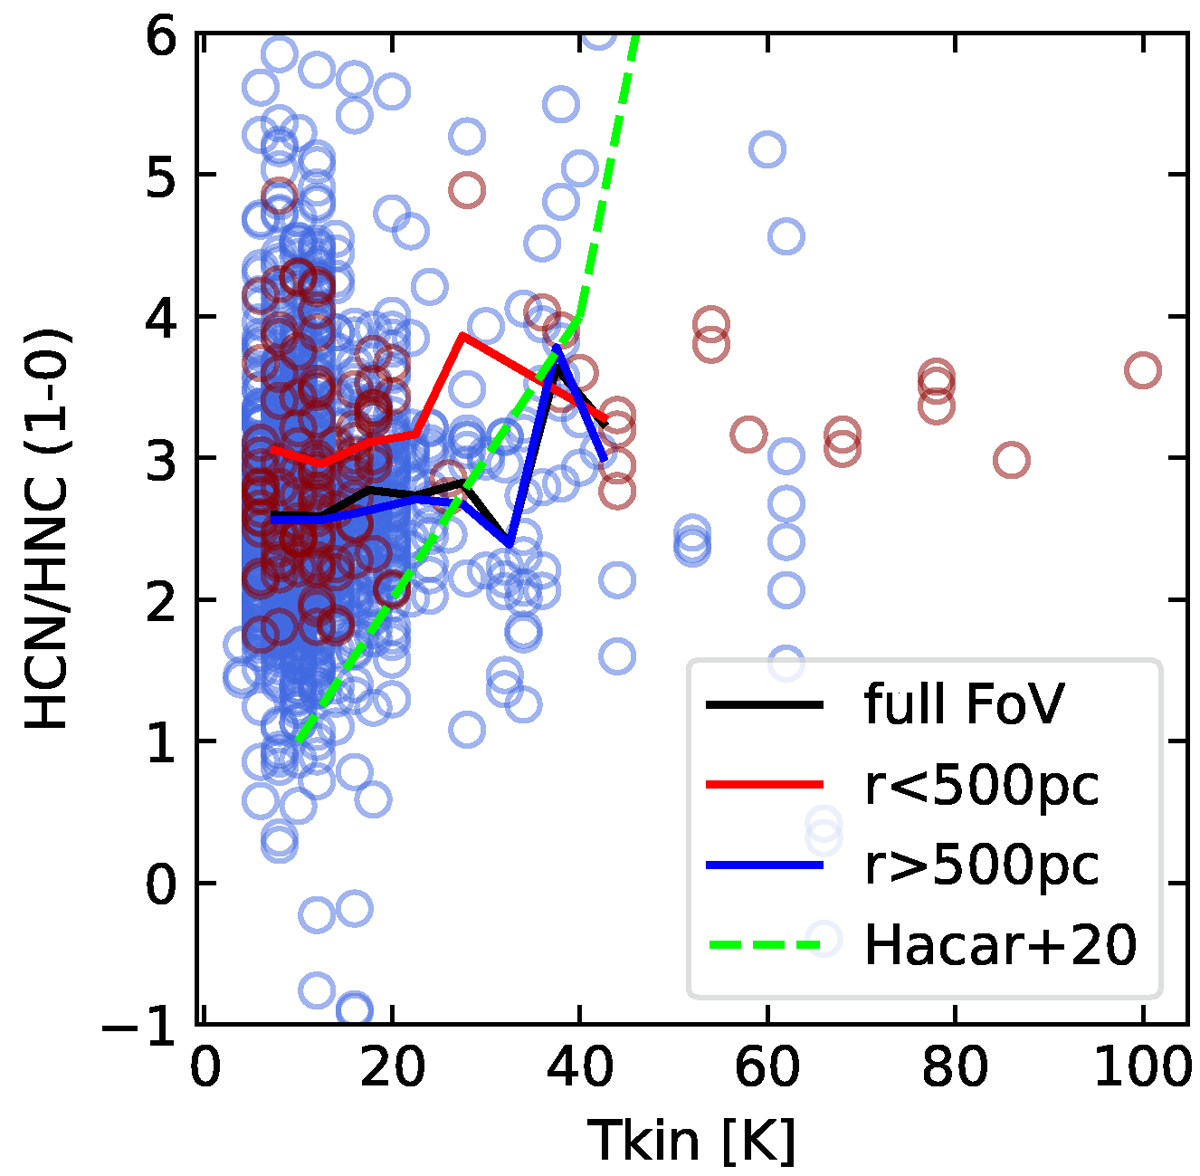
Download original image
HCN/HNC line ratio from this work as a function of kinetic gas temperature measurements at 4″ resolution from den Brok et al. (2025). We separate pixels in the center (r < 500 pc, red points) and disk (r > 500 pc, blue points), and provide binned estimates for the full FoV (black line), center, and disk (red, blue, respectively) in steps of 5K in the range ∼10 − 50 K, suggested by Hacar et al. (2020). We add the fitted relation from Hacar et al. (2020) (dashed green line).
Current usage metrics show cumulative count of Article Views (full-text article views including HTML views, PDF and ePub downloads, according to the available data) and Abstracts Views on Vision4Press platform.
Data correspond to usage on the plateform after 2015. The current usage metrics is available 48-96 hours after online publication and is updated daily on week days.
Initial download of the metrics may take a while.