Open Access
Fig. 16.
Download original image
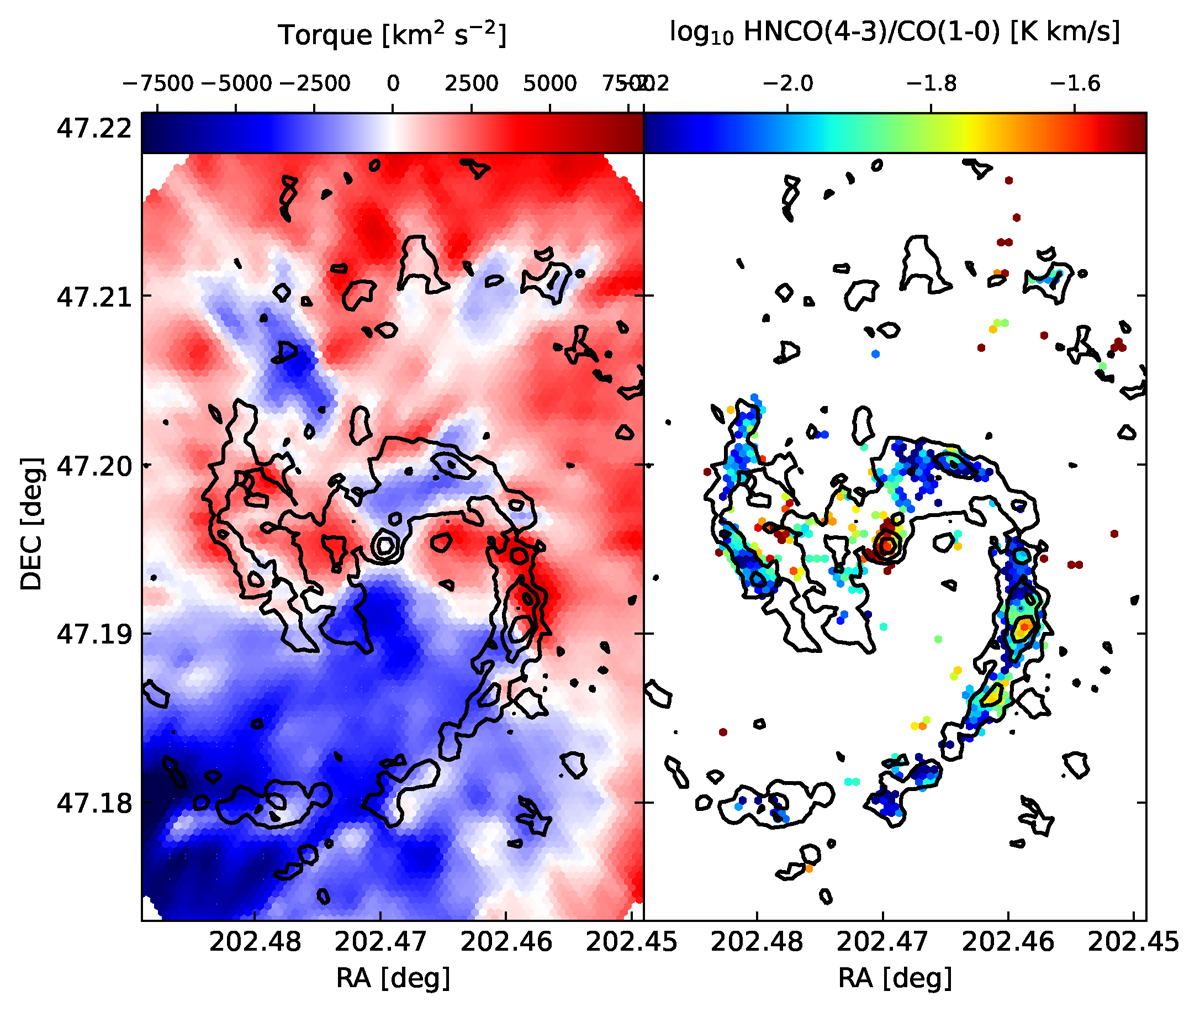
Left: Torques per unit mass from Querejeta et al. (2016b) estimated from dust corrected (3.6 μm) Spitzer images. Right: HNCO(4–3)/CO(1–0) emission from SWAN (Stuber et al. 2025) for pixels where HNCO(4–3) is detected > 3σ. N2H+ contours are plotted on top.
Current usage metrics show cumulative count of Article Views (full-text article views including HTML views, PDF and ePub downloads, according to the available data) and Abstracts Views on Vision4Press platform.
Data correspond to usage on the plateform after 2015. The current usage metrics is available 48-96 hours after online publication and is updated daily on week days.
Initial download of the metrics may take a while.