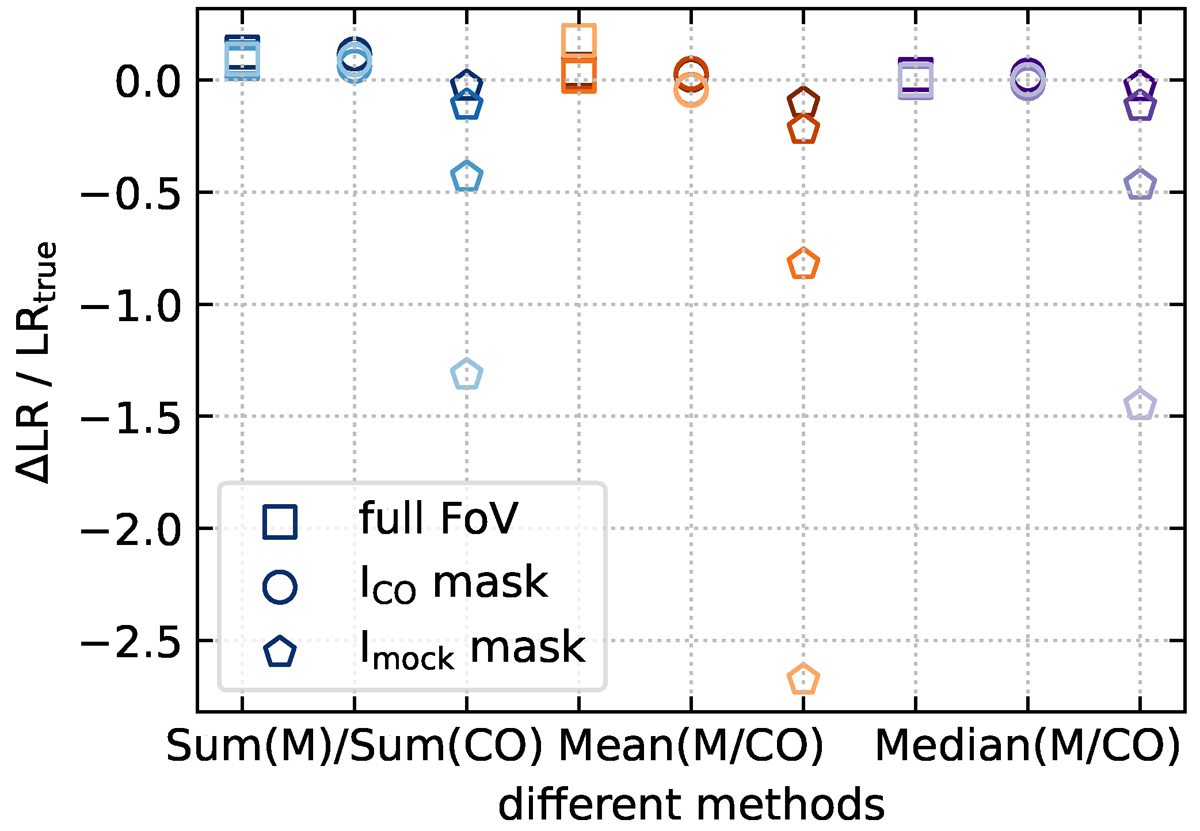
Fig. A.2.
Download original image
Testing different methods to calculate CO line ratios and the effect of masking. We show the relative difference between the true and measured line ratio ΔLR/LRtrue with ΔLR=LRtrue - LRmeasured. We estimate the measured line ratio LRmeasured per three different methods (sum: sum(M)/sum(CO) in blue, mean: mean(M/CO) in orange, median: median(mock/CO) in purple) with M and CO indicating the intensity of the mock and CO data, respectively. We further test the impact of different masking on the moment maps: Utilizing all pixels in the FoV (squares), only pixels where CO is significantly detected (> 3σ, circle), and only pixels where N2H+ is significantly detected (> 3σ, pentagons). The color gradient indicates the S/N of the data cube (measured via LRtrue), with darker color being LRtrue = 0.024 and the faintest color LRtrue = 0.0036. Points of the same color (albeit different gradient) belong to the same method.
Current usage metrics show cumulative count of Article Views (full-text article views including HTML views, PDF and ePub downloads, according to the available data) and Abstracts Views on Vision4Press platform.
Data correspond to usage on the plateform after 2015. The current usage metrics is available 48-96 hours after online publication and is updated daily on week days.
Initial download of the metrics may take a while.