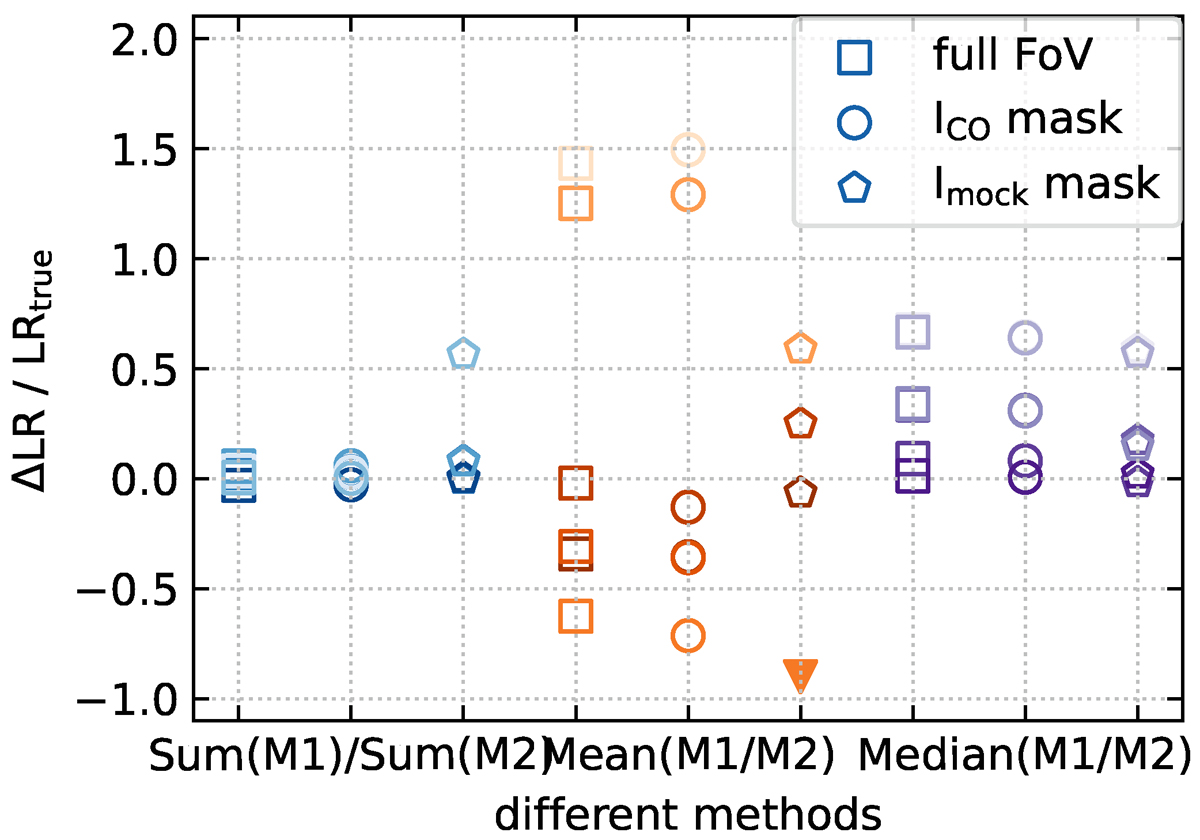
Fig. A.3.
Download original image
Testing the effect of masking on different methods to calculate average line ratios of mock-data. Same as Fig. A.2 but for line ratios between different mock datasets. The color gradient indicates the expected line ratio (measured via LRtrue). The ratio of Mock41 and Mock227 results in the largest line ratio (and thus faintest data point). Two outliers with large ΔLR/LRtrue are only shown as lower limits (colored triangle).
Current usage metrics show cumulative count of Article Views (full-text article views including HTML views, PDF and ePub downloads, according to the available data) and Abstracts Views on Vision4Press platform.
Data correspond to usage on the plateform after 2015. The current usage metrics is available 48-96 hours after online publication and is updated daily on week days.
Initial download of the metrics may take a while.