Fig. A.4.
Download original image
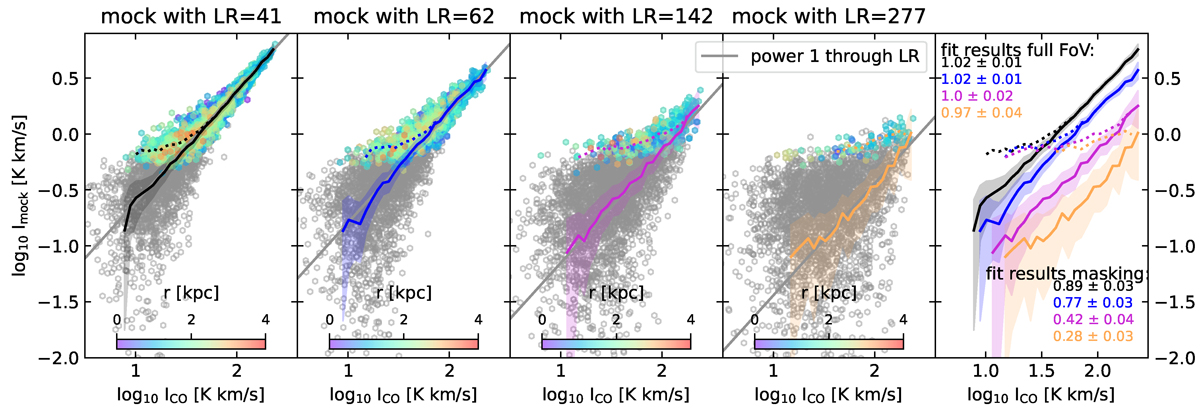
Testing the effect of binning to recover average line relations. We show the intensity of each pixel in the mock-moment-0 map (Imock) as function of the correponding intensity in the 12CO moment-0 map (ICO. The different mock data are simulated based on 12CO data scaled by a line ratio of 0.024, 0.016, 0.007, 0.0036 (aka LR: 41, 62, 142, 277). The expected relation (black dashed line) corresponds to line ratio used to create the mock data (power of 1, offset corresponds to the line ratio). We highlight pixels where Imock is significantly detected (>3σ, colored data points) and indicate their galactocentric distance by color. We bin Imock in logarithmic steps of ICO for all pixels in the FoV (solid line), as well as when only including pixels with significant detections (dotted line). We add the slopes of linear fits fitted to the binned data for the full FoV and the masked data.
Current usage metrics show cumulative count of Article Views (full-text article views including HTML views, PDF and ePub downloads, according to the available data) and Abstracts Views on Vision4Press platform.
Data correspond to usage on the plateform after 2015. The current usage metrics is available 48-96 hours after online publication and is updated daily on week days.
Initial download of the metrics may take a while.