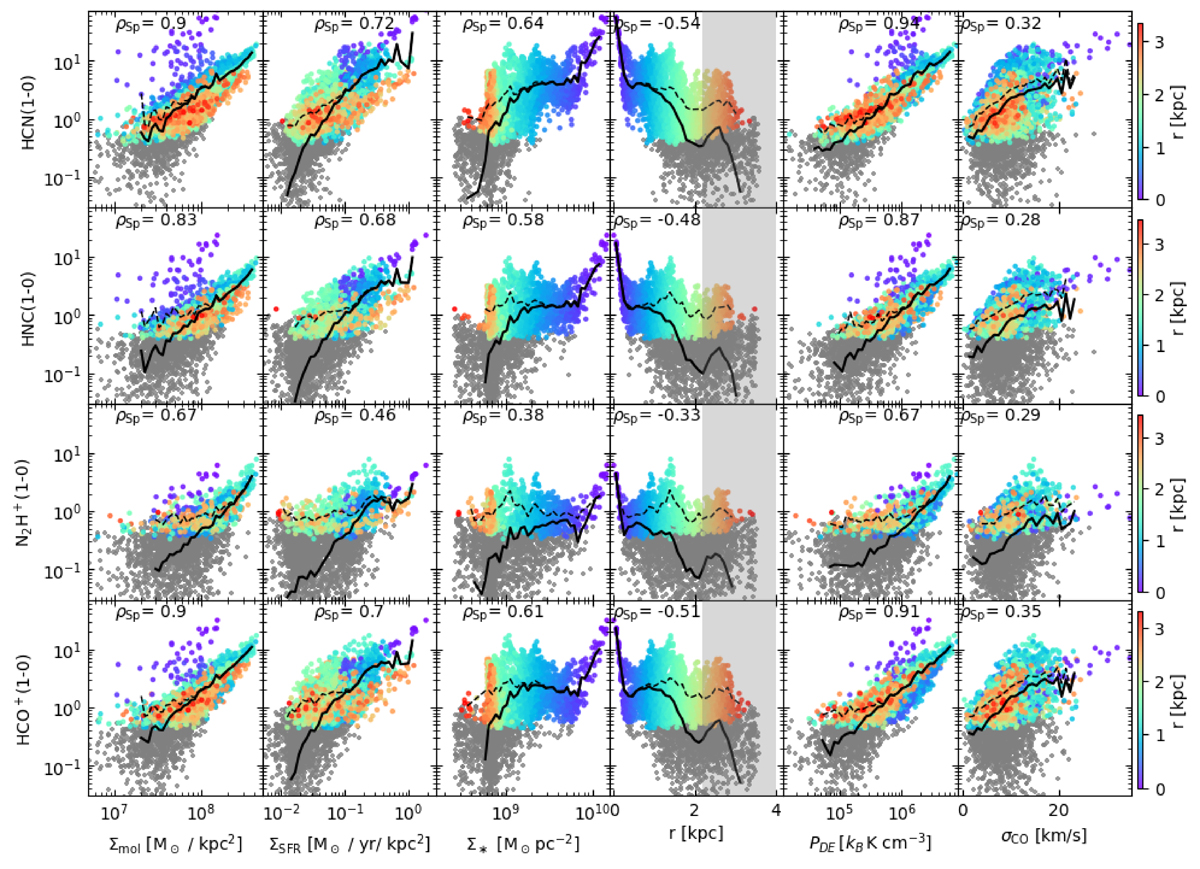
Fig. E.1.
Download original image
Pixel-by-pixel integrated line intensities for HCN, HNC, N2H+, HCO+(1–0) as function of Σmol, ΣSFR, Σ*, galactocentric radius, PDE and σCO for both detected emission (> 3σ, colored by galactocentric distance) as well as all data (gray). Pixels with detected emission are colored by galactocentric radius. We show the binned average for all data (black solid line) and significant data (black dashed line). We add Spearman correlation coefficients using all data in the top left corner of each panel, but note that those coefficients strongly depend on the S/N of the line and a decrease in coefficients from brighter to fainter lines is expected (i.e. from HCN to N2H+). All p-values are below 5%.
Current usage metrics show cumulative count of Article Views (full-text article views including HTML views, PDF and ePub downloads, according to the available data) and Abstracts Views on Vision4Press platform.
Data correspond to usage on the plateform after 2015. The current usage metrics is available 48-96 hours after online publication and is updated daily on week days.
Initial download of the metrics may take a while.