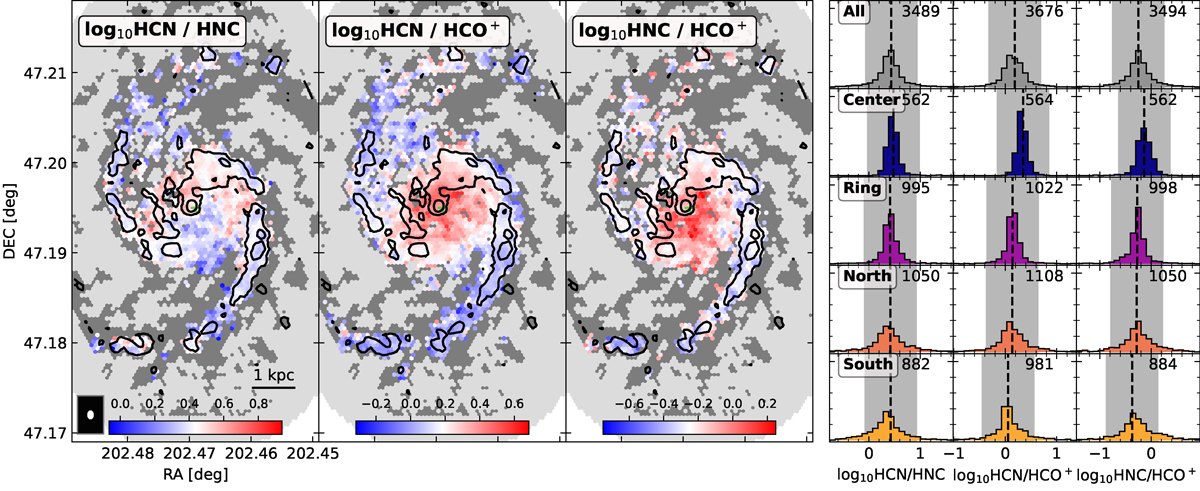
Fig. 3.
Download original image
Left panel: Line ratios of integrated line emission from dense gas tracers HCN, HNC, and HCO+. For visual purposes, we only show line ratios for significant detected pixels (> 3σ), but include nondetections in all calculations. We mark pixels in which CO is detected (gray points) and the center of the galaxy (green plus). The intensity scale is centered logarithmically on the average line ratios (log10R, with R from Table 2) determined for all pixels in the FoV, including nondetections. The average line ratio (log10R) and the total range of 1 dex covered by the color bar are indicated by the dashed black line and gray shaded area in the right panel. We show contours of integrated N2H+ emission (0.75, 3 K km/s) on top. Right panel: Histogram of line ratios per environment analogous to Fig. 1 but for HCN/HNC, HCN/HCO+, and HNC/HCO+ (colored histograms). We indicate the number of pixels shown in the histogram (top right corner), which varies slightly, as values with negative noise cannot be shown in the logarithmic scale.
Current usage metrics show cumulative count of Article Views (full-text article views including HTML views, PDF and ePub downloads, according to the available data) and Abstracts Views on Vision4Press platform.
Data correspond to usage on the plateform after 2015. The current usage metrics is available 48-96 hours after online publication and is updated daily on week days.
Initial download of the metrics may take a while.