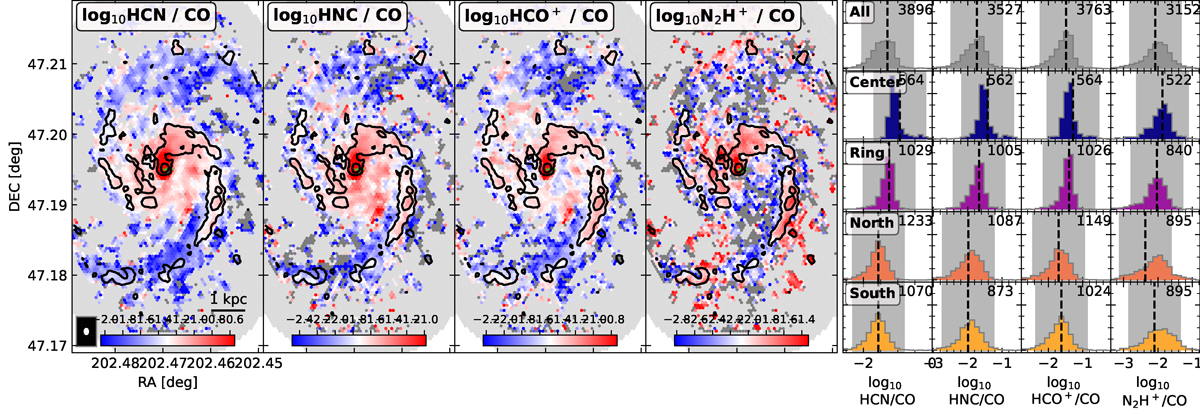
Fig. 5.
Download original image
Same as Figs. 3 and 4 but for line ratios with CO. In contrast to the previous figures, the colorbar spans a larger range of 1.5 dex, centered on the average line ratios (Table 2), and we add line ratios in pixels with nondetections. Since we show the logarithmic line ratio, negative values that arise from negative noise cannot be shown in either the spatial map or the histograms. We mark pixels where CO is significantly detected, but the line ratio cannot be shown in logarithmic scaling in dark gray. The contours depict integrated N2H+ emission at 0.75 and 3 K km/s.
Current usage metrics show cumulative count of Article Views (full-text article views including HTML views, PDF and ePub downloads, according to the available data) and Abstracts Views on Vision4Press platform.
Data correspond to usage on the plateform after 2015. The current usage metrics is available 48-96 hours after online publication and is updated daily on week days.
Initial download of the metrics may take a while.