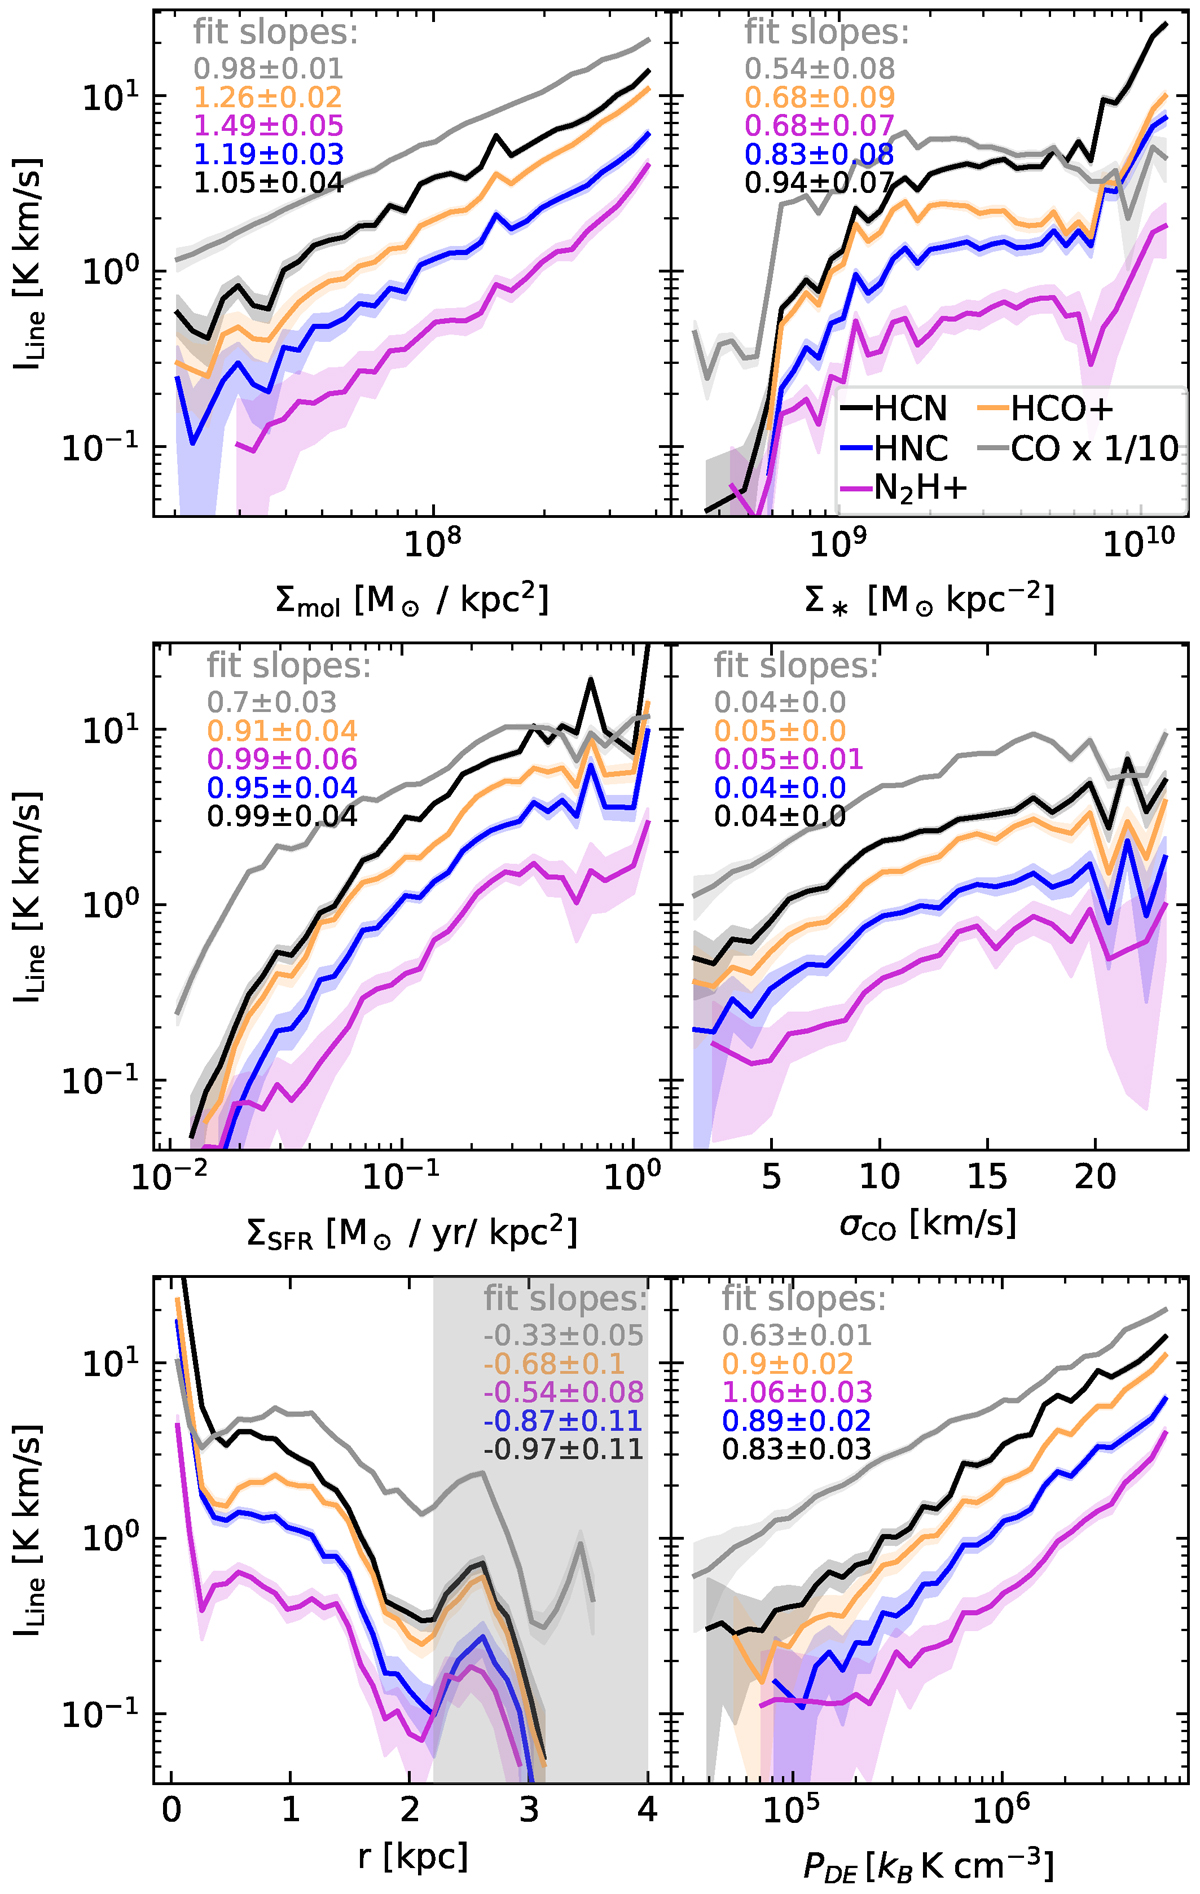
Fig. 7.
Download original image
Average line intensity, ILine, as a function of surface densities of molecular gas mass (Σmol), stellar mass (Σ*), and star-formation rate (ΣSFR), as well as velocity dispersion (σCO), dynamical equilibrium pressure (PDE), and galactocentric radius for all dense gas tracers. Shaded areas mark the standard deviation per bin. The 12CO intensity scaled by a factor of 1/10 is added for comparison (gray line). For r > 2.2 kpc, the shape of our FoV leads to incomplete sampling of these radial bins (gray shaded area). The obtained slopes for a linear fit (in log space) to the binned averages are provided in each panel.
Current usage metrics show cumulative count of Article Views (full-text article views including HTML views, PDF and ePub downloads, according to the available data) and Abstracts Views on Vision4Press platform.
Data correspond to usage on the plateform after 2015. The current usage metrics is available 48-96 hours after online publication and is updated daily on week days.
Initial download of the metrics may take a while.