Fig. 1.
Download original image
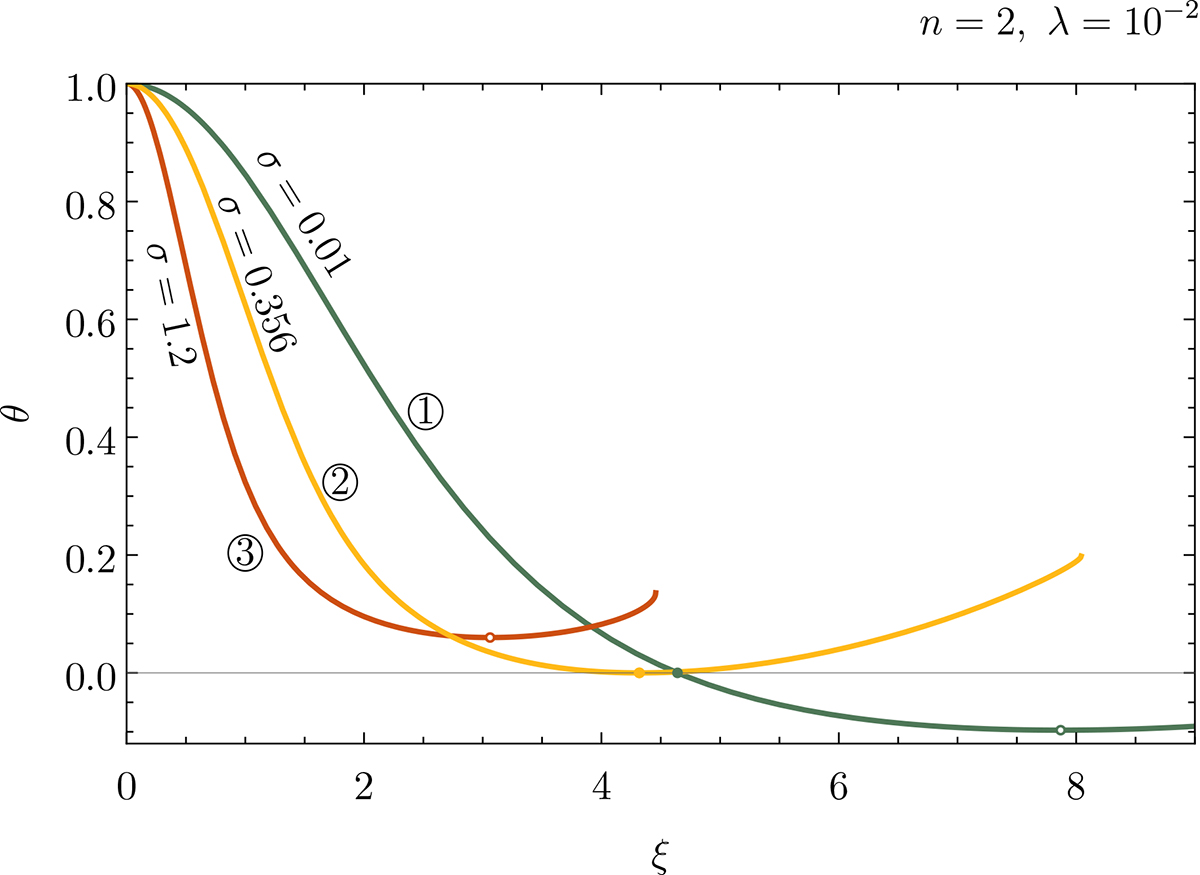
Dependence of the pressure, θ, to the dimensionless radial coordinate, ξ. The surface of the polytropic sphere is determined by the first zero of θ(ξ), if it exists. Such points are depicted on the plot by solid dots, see curves ① and ②. The expected θ-curve (corresponding to pressure) is a monotonically decreasing function. As a manifestation of the influence of the cosmological parameter λ, the θ function can start to increase even before the first zero is reached, see curve ③. Change of monotonicity occurs in local minimum dθ/dξ = 0 and if such a minimum occurs at ξ1, where θ(ξ1) = 0, such a point is identified as the “static radius of the external spacetime” of such a polytrope, ξs = 3ν(ξ1)/2λ, see curve ②. If θ(ξmin) > 0 at such a minimum localized at ξmin, like on the curve ③, the ratio ![]() . At the center of each configuration, the value of
. At the center of each configuration, the value of ![]() is smaller than 1 for λ < 1/2 (we take our attention only to the positive cosmological constant). Thus, for curves like ③, there exists a point in the interval 0 < ξ < ξmin, where ξ = 3ν(ξ)/2λ. We do not consider such cases in the present paper, postponing them for a future study. (Notice that calculation to the negative values of θ is possible only for special values of n and the corresponding part of the curve ① is shown here for illustration only. Generally, such curves end on θ = 0. Depicted ends of the curves ② and ③ are due to the stiffness problem, which does not need to be overcome in normal situations as we stop calculation at ξ1 or ξmin.)
is smaller than 1 for λ < 1/2 (we take our attention only to the positive cosmological constant). Thus, for curves like ③, there exists a point in the interval 0 < ξ < ξmin, where ξ = 3ν(ξ)/2λ. We do not consider such cases in the present paper, postponing them for a future study. (Notice that calculation to the negative values of θ is possible only for special values of n and the corresponding part of the curve ① is shown here for illustration only. Generally, such curves end on θ = 0. Depicted ends of the curves ② and ③ are due to the stiffness problem, which does not need to be overcome in normal situations as we stop calculation at ξ1 or ξmin.)
Current usage metrics show cumulative count of Article Views (full-text article views including HTML views, PDF and ePub downloads, according to the available data) and Abstracts Views on Vision4Press platform.
Data correspond to usage on the plateform after 2015. The current usage metrics is available 48-96 hours after online publication and is updated daily on week days.
Initial download of the metrics may take a while.