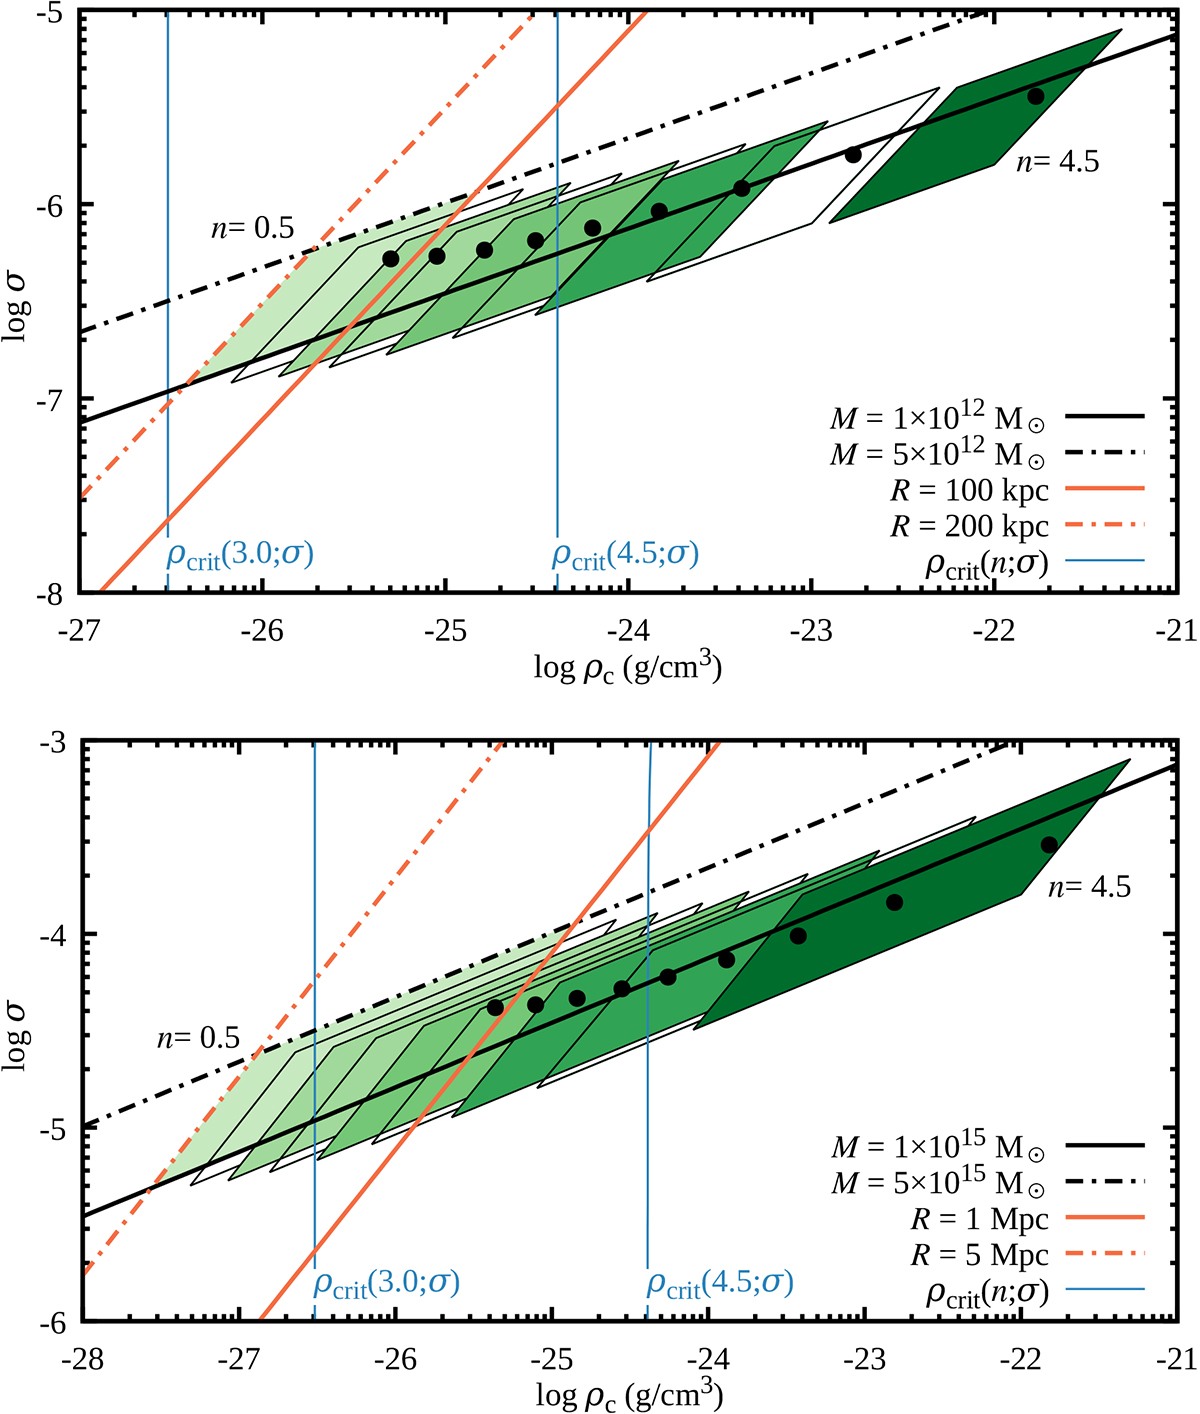
Fig. 10.
Download original image
Allowed regions of galaxy-like and cluster-like polytropes in the nonrelativistic regime. The figure shows the polytrope extension, R, and mass, M, at the edges of the selected intervals R = 100–200 kpc and M = 1–5 × 10¹² M⊙ (top figure) and R = 1–5 Mpc & M = 1–5 × 10¹⁵ M⊙ (bottom figure). We are drawing only the extensions R and M for the polytropic index n = 0.5 (4 lines). However, the “polygon shape” intersections are demonstrated for n = 0.5 up to n = 4.5 with step size 0.5. The intersection for n = 0.5 is the leftmost one, for n = 1.0 the intersection region is located to the right of the previous one, and so on. Also, the non-integers n are filled with single hue color (increasing the hue for higher polytropic index) for a better overview. The two vertical lines correspond to the critical value ρcrit(n; σ), i.e., the λcrit(n; σ) (see Section 4) for two polytropic index (4.5,3.0). The configurations for the particular n can only exists on the right side of the curve. The dots represent the selected points for the polytropic spheres whose profiles are given in the next section.
Current usage metrics show cumulative count of Article Views (full-text article views including HTML views, PDF and ePub downloads, according to the available data) and Abstracts Views on Vision4Press platform.
Data correspond to usage on the plateform after 2015. The current usage metrics is available 48-96 hours after online publication and is updated daily on week days.
Initial download of the metrics may take a while.