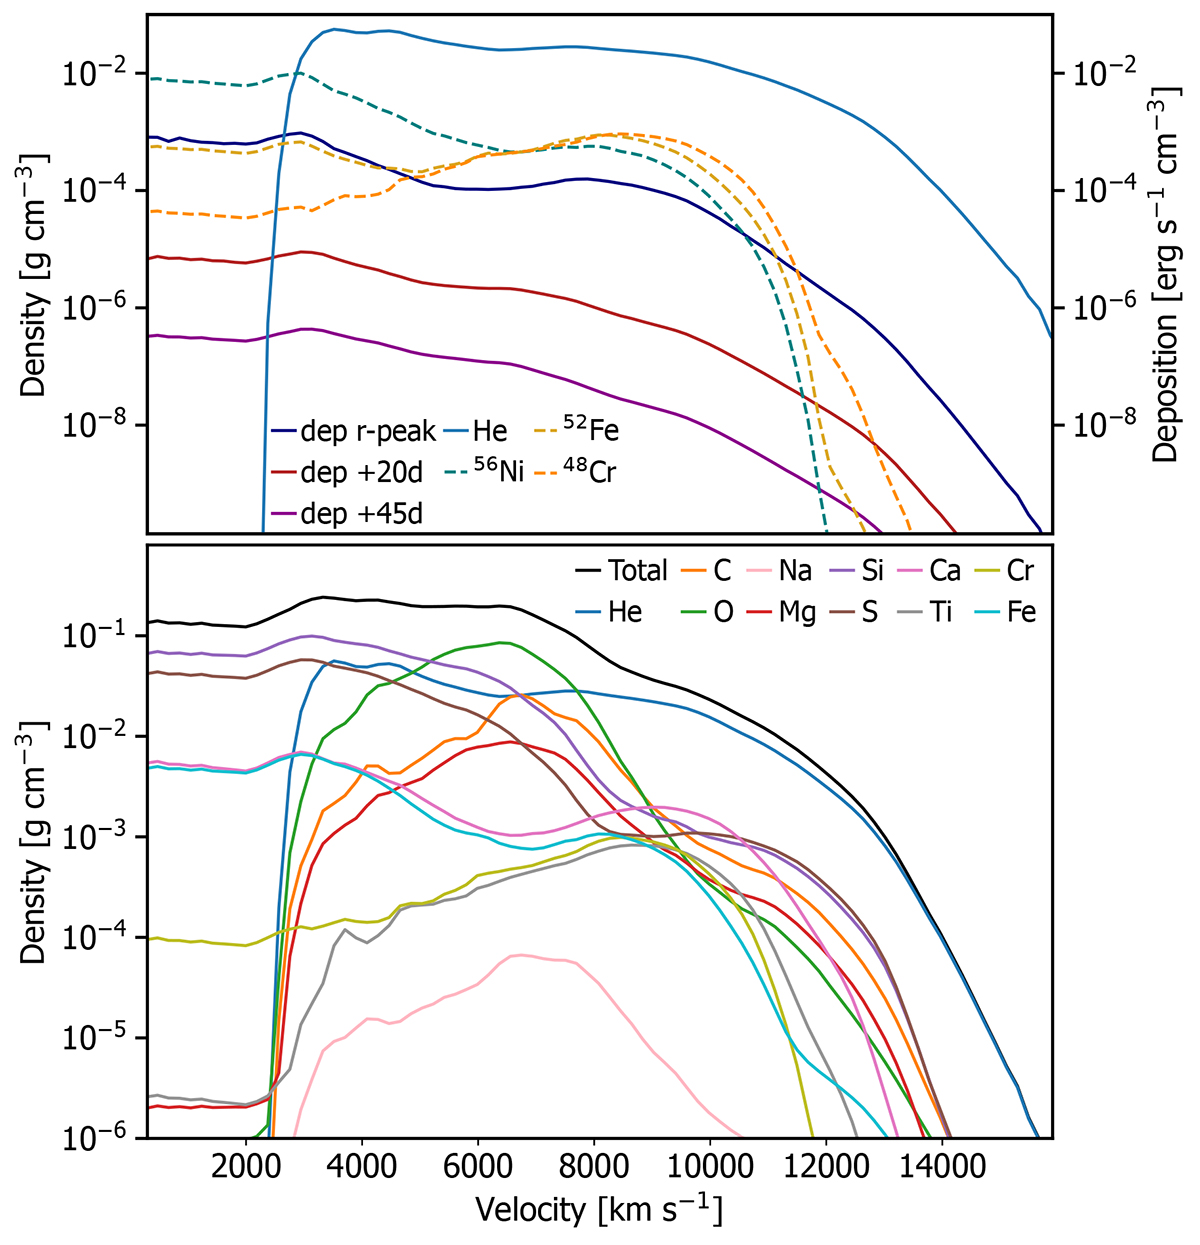
Fig. 1.
Download original image
Bottom panel: model ejecta composition at 160 s after explosion for key species in the simulation. Top panel: energy deposition profiles for the three epochs we show spectra for. Overplotted for reference are the density profiles of He and key radioisotopes that we track the decay chain energy deposition for in the simulation.
Current usage metrics show cumulative count of Article Views (full-text article views including HTML views, PDF and ePub downloads, according to the available data) and Abstracts Views on Vision4Press platform.
Data correspond to usage on the plateform after 2015. The current usage metrics is available 48-96 hours after online publication and is updated daily on week days.
Initial download of the metrics may take a while.