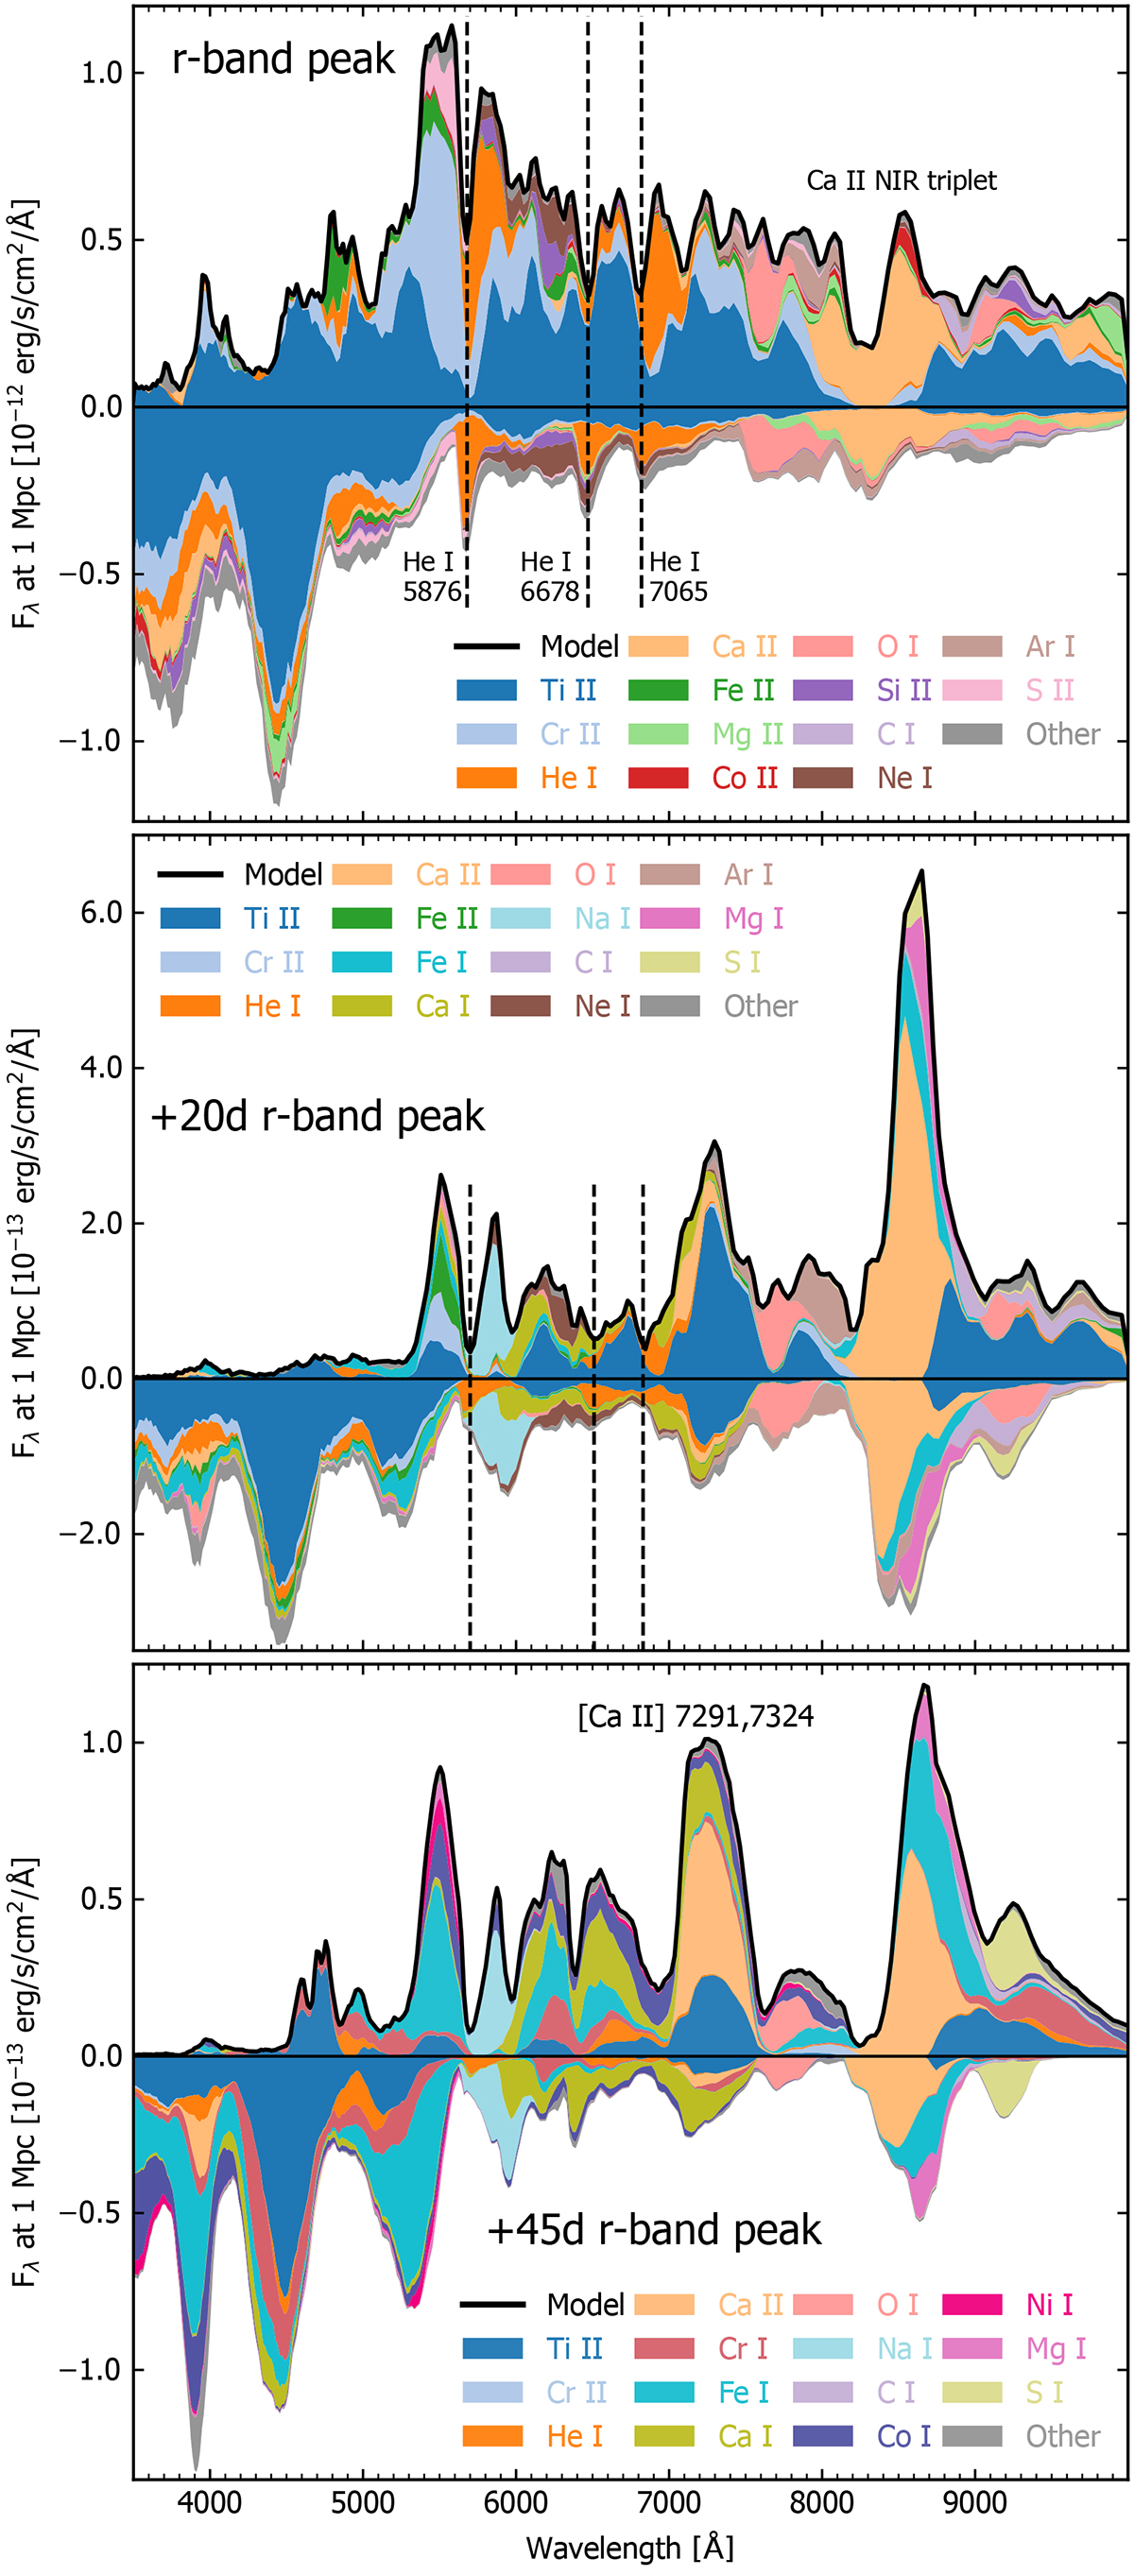
Fig. 2.
Download original image
Optical spectroscopic evolution of our model from peak until the early nebular phase. The last species with which packets interacted before they left the simulation are indicated with different colours. Contributions to emission are plotted on the positive axis, and contributions to absorption on the negative axis. For reference, key lines are labelled along with their rest wavelength (given in Å). The dashed lines indicate the wavelengths of absorptions from the prominent optical He I lines.
Current usage metrics show cumulative count of Article Views (full-text article views including HTML views, PDF and ePub downloads, according to the available data) and Abstracts Views on Vision4Press platform.
Data correspond to usage on the plateform after 2015. The current usage metrics is available 48-96 hours after online publication and is updated daily on week days.
Initial download of the metrics may take a while.