Fig. 4.
Download original image
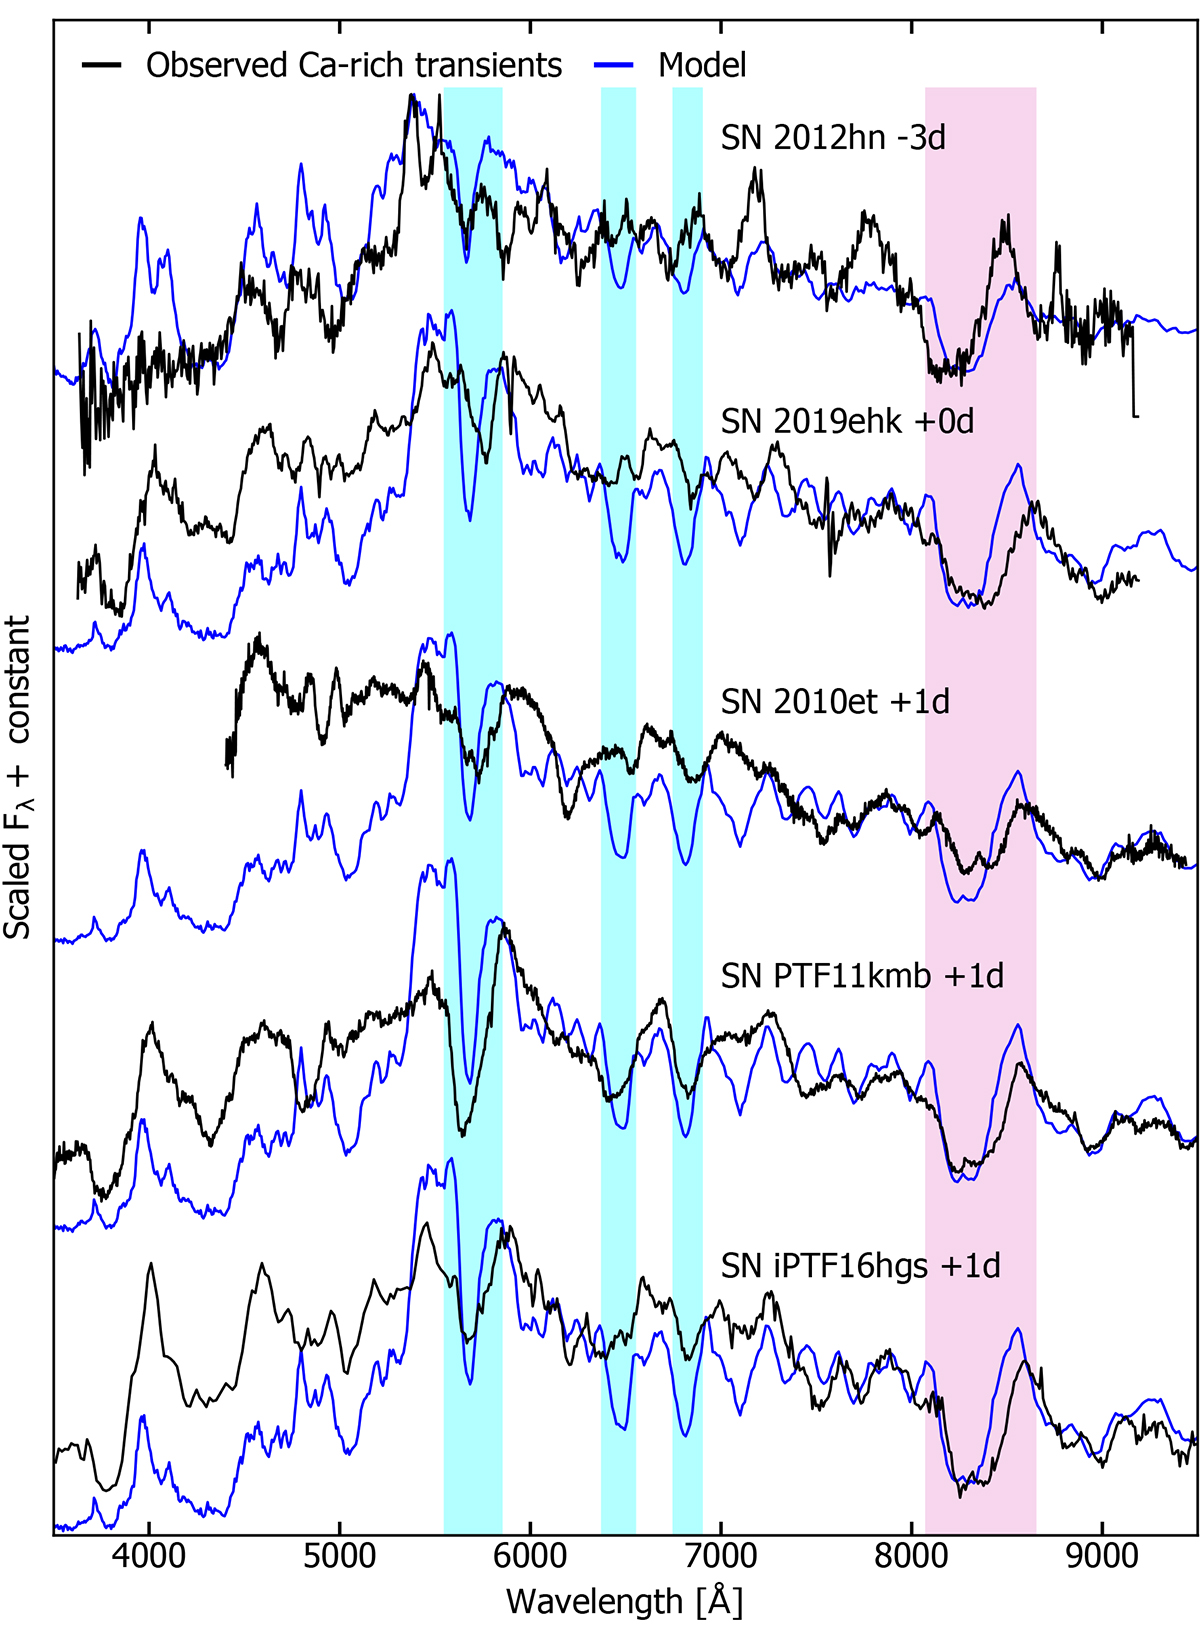
Spectroscopic comparisons around peak of our simulated spectra with the observed Ca-rich transients SN 2012hn (Valenti et al. 2014), SN 2019ehk (Jacobson-Galán et al. 2020b; Nakaoka et al. 2021), SN 2010et (Kasliwal et al. 2012), SN PTF11kmb (Lunnan et al. 2017), and SN iPTF16hgs (De et al. 2018). The model epochs are relative to the Sloan r-band peak and have been chosen to match the epochs of each observed spectrum relative to either the Sloan r-band or the Bessel R-band peak. For reference, the strong optical He I features, attributed to the He I 5876, 6678, and 7065 Å lines, are highlighted in cyan and the Ca II NIR triplet is highlighted in pink.
Current usage metrics show cumulative count of Article Views (full-text article views including HTML views, PDF and ePub downloads, according to the available data) and Abstracts Views on Vision4Press platform.
Data correspond to usage on the plateform after 2015. The current usage metrics is available 48-96 hours after online publication and is updated daily on week days.
Initial download of the metrics may take a while.