Fig. 5.
Download original image
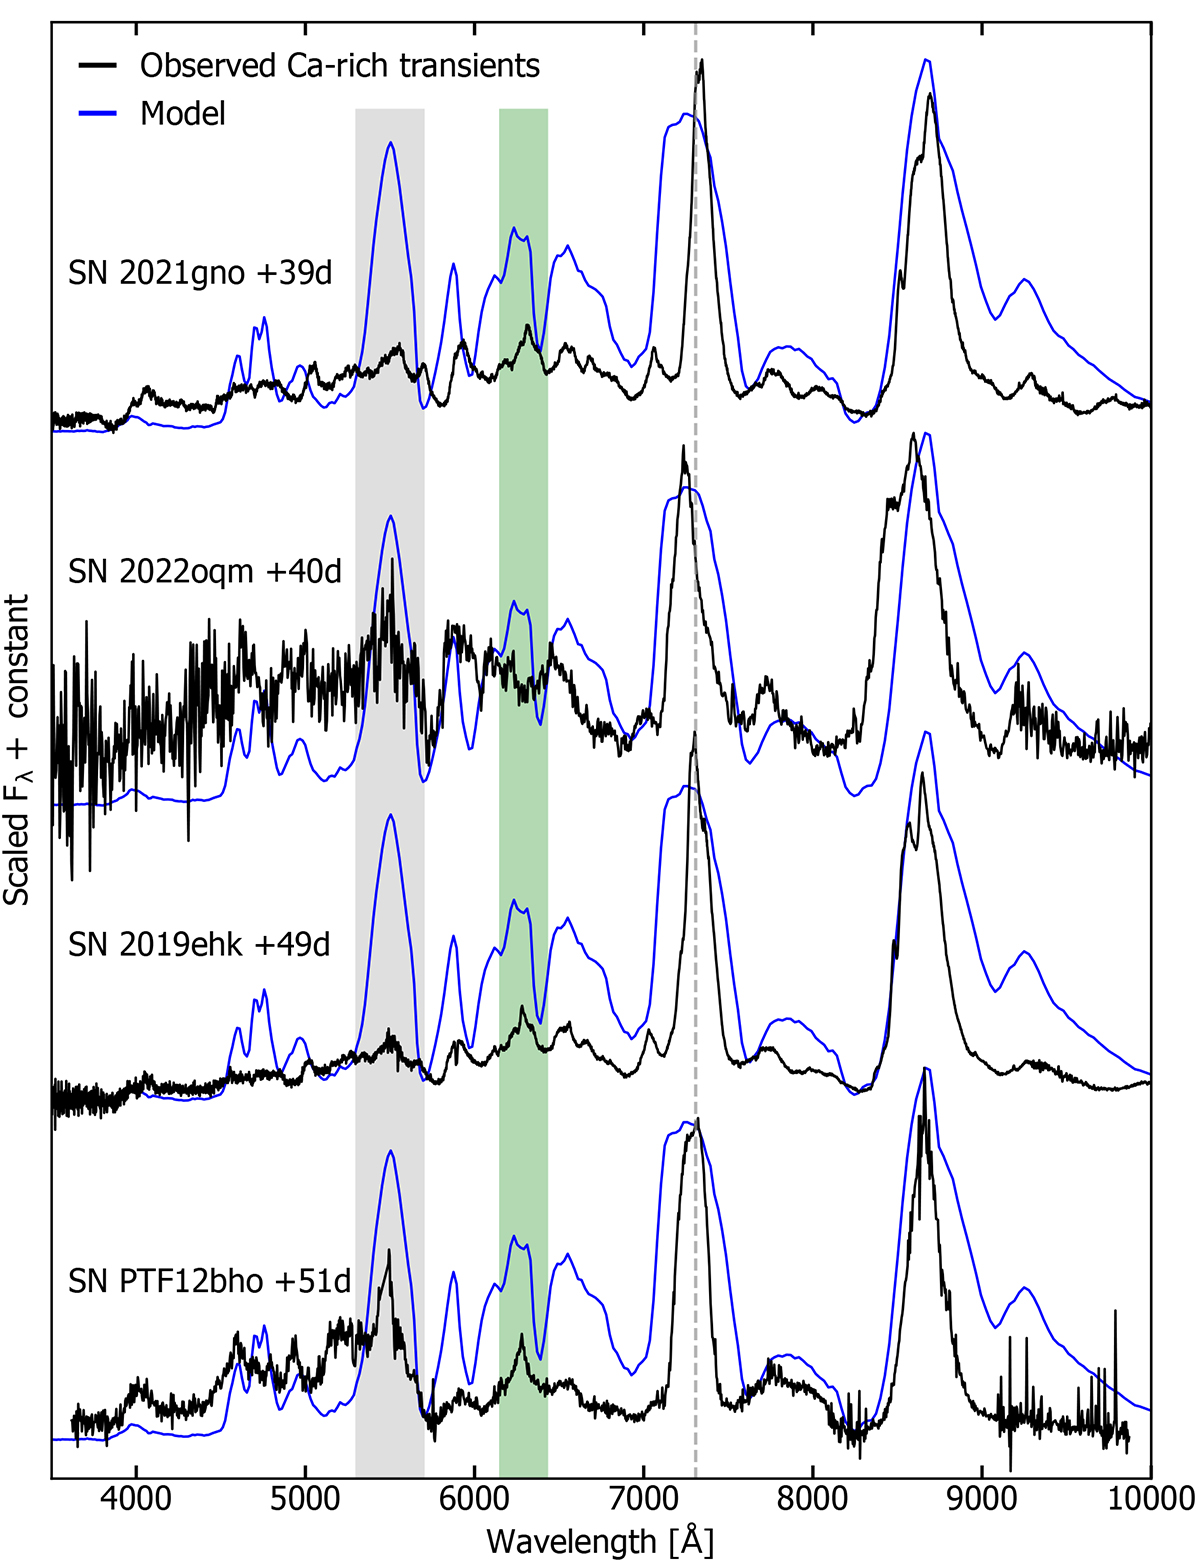
Nebular phase spectroscopic comparisons of our simulated spectra at 45 d post r-band peak and the observed Ca-rich transients SN 2021gno (Jacobson-Galán et al. 2022; Ertini et al. 2023), SN 2022oqm (Yadavalli et al. 2024), SN 2019ehk (Jacobson-Galán et al. 2020b; Nakaoka et al. 2021), and SN PTF12bho (Lunnan et al. 2017) at similar epochs. The epochs of the observations are relative to the Sloan r-band or Bessel R-band peak. For reference, the dashed grey line is plotted between the rest wavelengths of the key [Ca II] 7291, 7324 Å lines, the Fe I emission feature predicted by the simulation is highlighted in grey, and the location of the [O I] 6300, 6364 Å feature commonly observed for Ca-rich transients is highlighted in green.
Current usage metrics show cumulative count of Article Views (full-text article views including HTML views, PDF and ePub downloads, according to the available data) and Abstracts Views on Vision4Press platform.
Data correspond to usage on the plateform after 2015. The current usage metrics is available 48-96 hours after online publication and is updated daily on week days.
Initial download of the metrics may take a while.