Fig. 1
Download original image
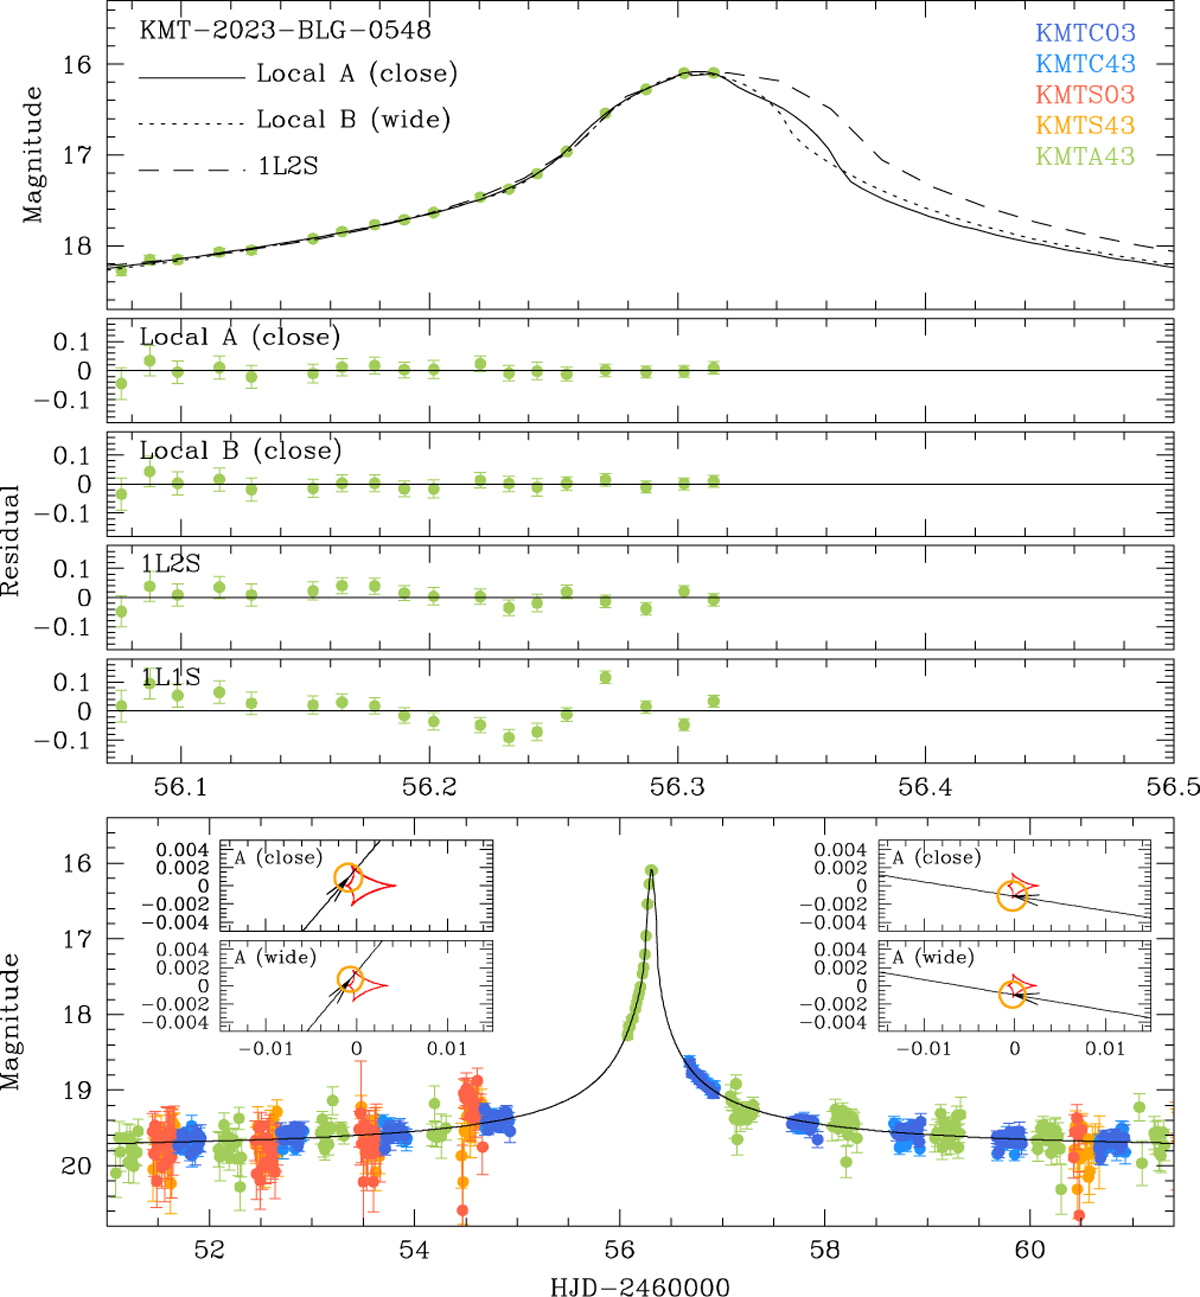
Light curve of the microlensing event KMT-2023-BLG-0548. The bottom panel displays the full light curve, while the upper panels present a zoomed-in view of the peak region along with the residuals for four different models. The four insets in the bottom panel illustrate the lens-system configurations corresponding to the four degenerate 2L1S solutions. In each inset, the closed figure composed of concave curves represents the caustics, and the arrowed line indicates the source trajectory. The orange circle, scaled to represent the angular size of the source, on the trajectory marks the source’s position at the moment of peak anomaly.
Current usage metrics show cumulative count of Article Views (full-text article views including HTML views, PDF and ePub downloads, according to the available data) and Abstracts Views on Vision4Press platform.
Data correspond to usage on the plateform after 2015. The current usage metrics is available 48-96 hours after online publication and is updated daily on week days.
Initial download of the metrics may take a while.