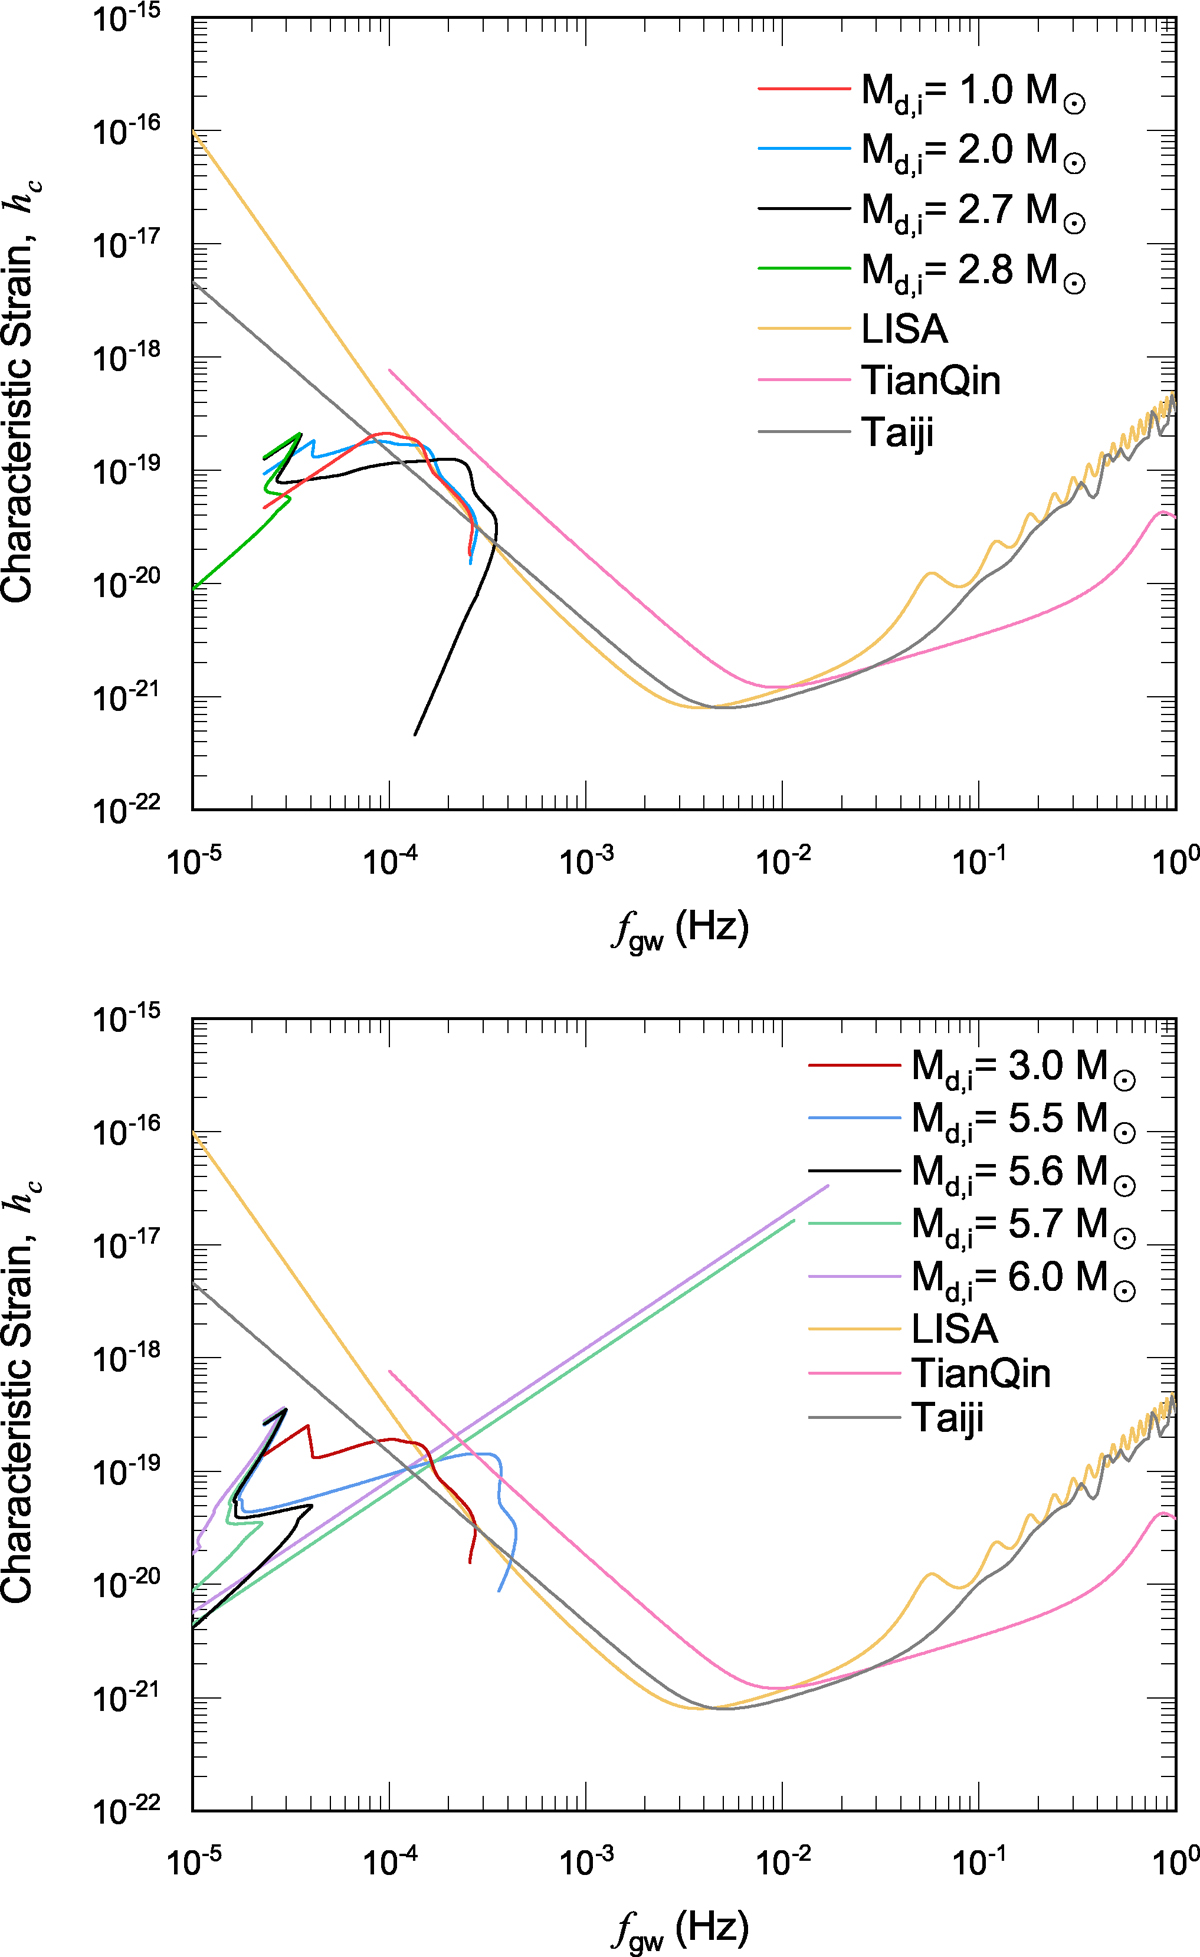
Fig. 4.
Download original image
Evolution of IMBH binaries with Porb,i = 1 day and varying donor-star masses. Top panel: Characteristic strain vs. GW frequency diagram when γ = 1.60; bottom panel: γ = 1.80. The blue curve shows the LISA sensitivity based on a numerical calculation for a mission duration of four years. The red and green curves correspond to the sensitivity curves of TianQin (Wang et al. 2019) and Taiji (Ruan et al. 2020), respectively.
Current usage metrics show cumulative count of Article Views (full-text article views including HTML views, PDF and ePub downloads, according to the available data) and Abstracts Views on Vision4Press platform.
Data correspond to usage on the plateform after 2015. The current usage metrics is available 48-96 hours after online publication and is updated daily on week days.
Initial download of the metrics may take a while.