Open Access
Fig. 1.
Download original image
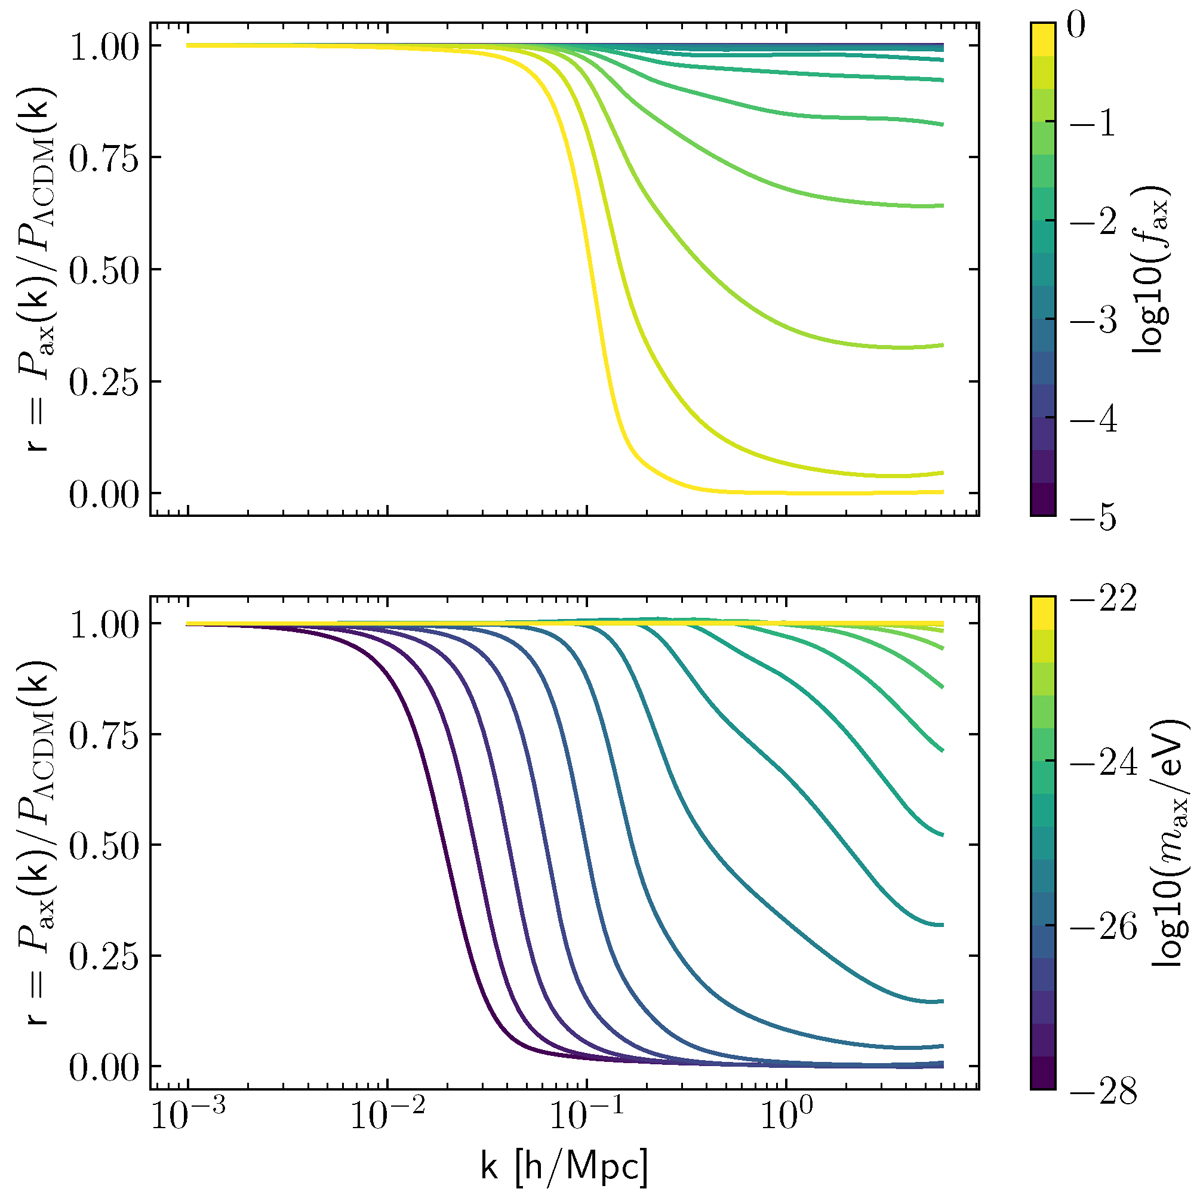
Example of the non-linear power spectrum ratio r for varying axion abundance (top panel) and axion mass (bottom panel). We use axion mass max = 10−26 eV in the top panel, and axion abundance fax = 0.5 in the bottom panel. The data in this figure was generated using the trained axion emulator described in this paper.
Current usage metrics show cumulative count of Article Views (full-text article views including HTML views, PDF and ePub downloads, according to the available data) and Abstracts Views on Vision4Press platform.
Data correspond to usage on the plateform after 2015. The current usage metrics is available 48-96 hours after online publication and is updated daily on week days.
Initial download of the metrics may take a while.