Fig. 6.
Download original image
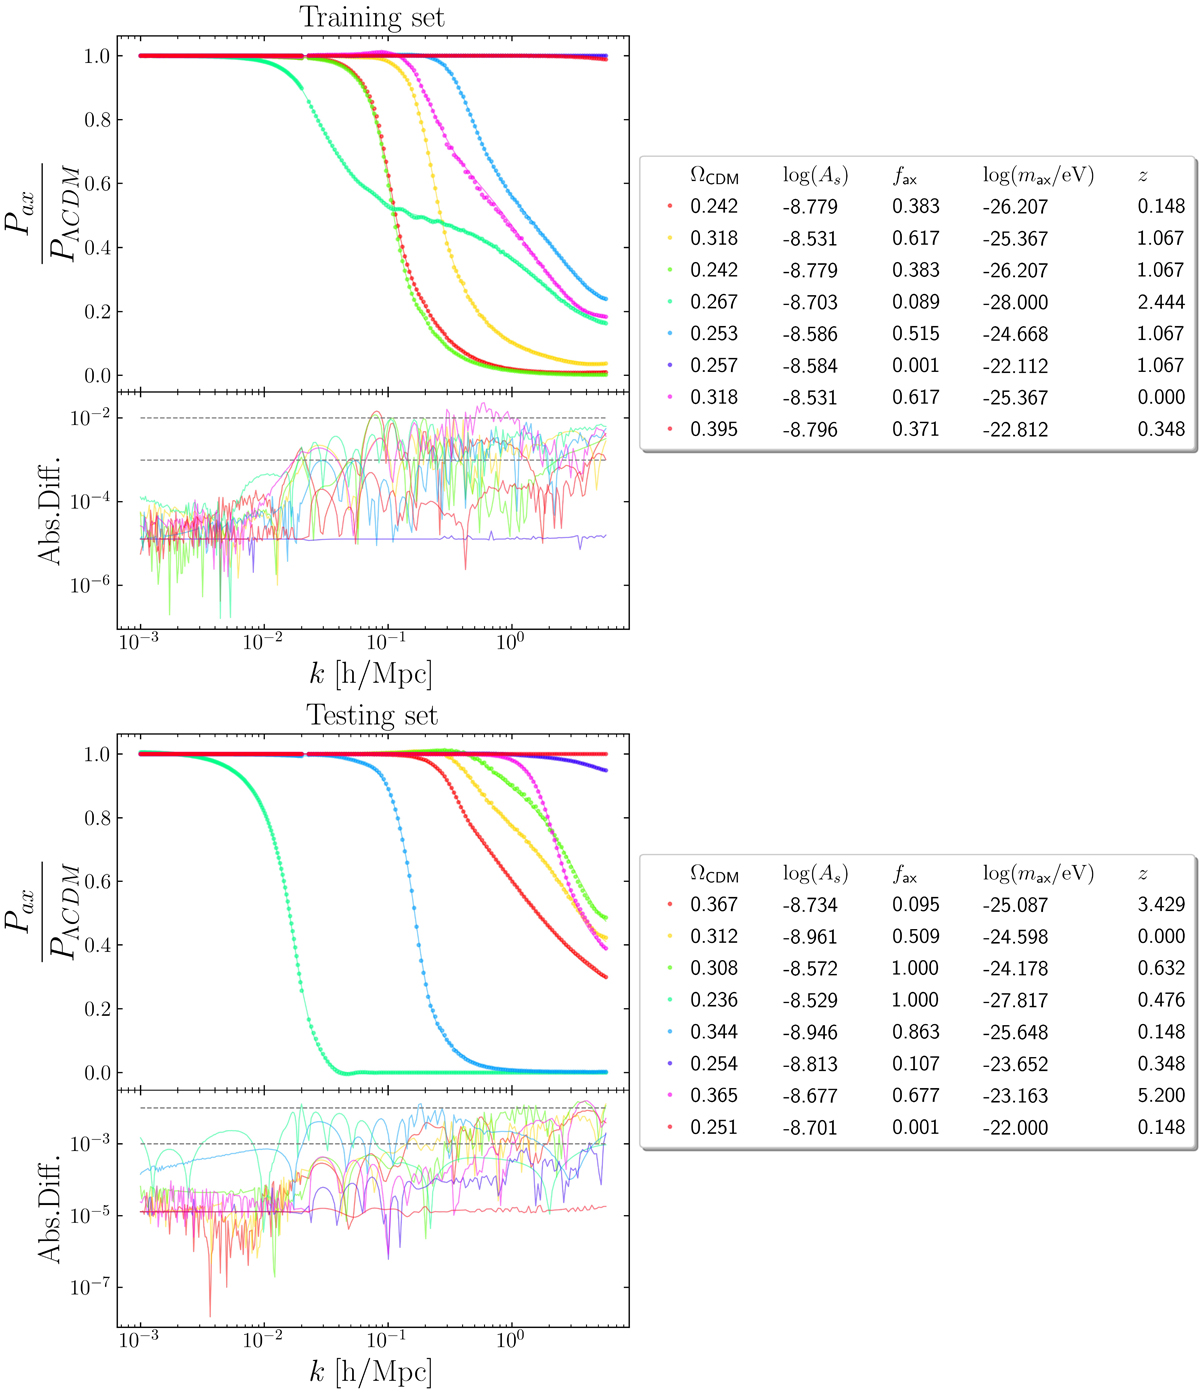
Emulator’s performance on the training data-set (top) and test-set (bottom). The top panel shows the emulators prediction compared to the data from the simulations, and the bottom panel shows the squared error between the two. Solid lines indicate the prediction of the emulator, while dots indicate the data from simulations, with each color specifying a different set of cosmological parameters.
Current usage metrics show cumulative count of Article Views (full-text article views including HTML views, PDF and ePub downloads, according to the available data) and Abstracts Views on Vision4Press platform.
Data correspond to usage on the plateform after 2015. The current usage metrics is available 48-96 hours after online publication and is updated daily on week days.
Initial download of the metrics may take a while.