Open Access
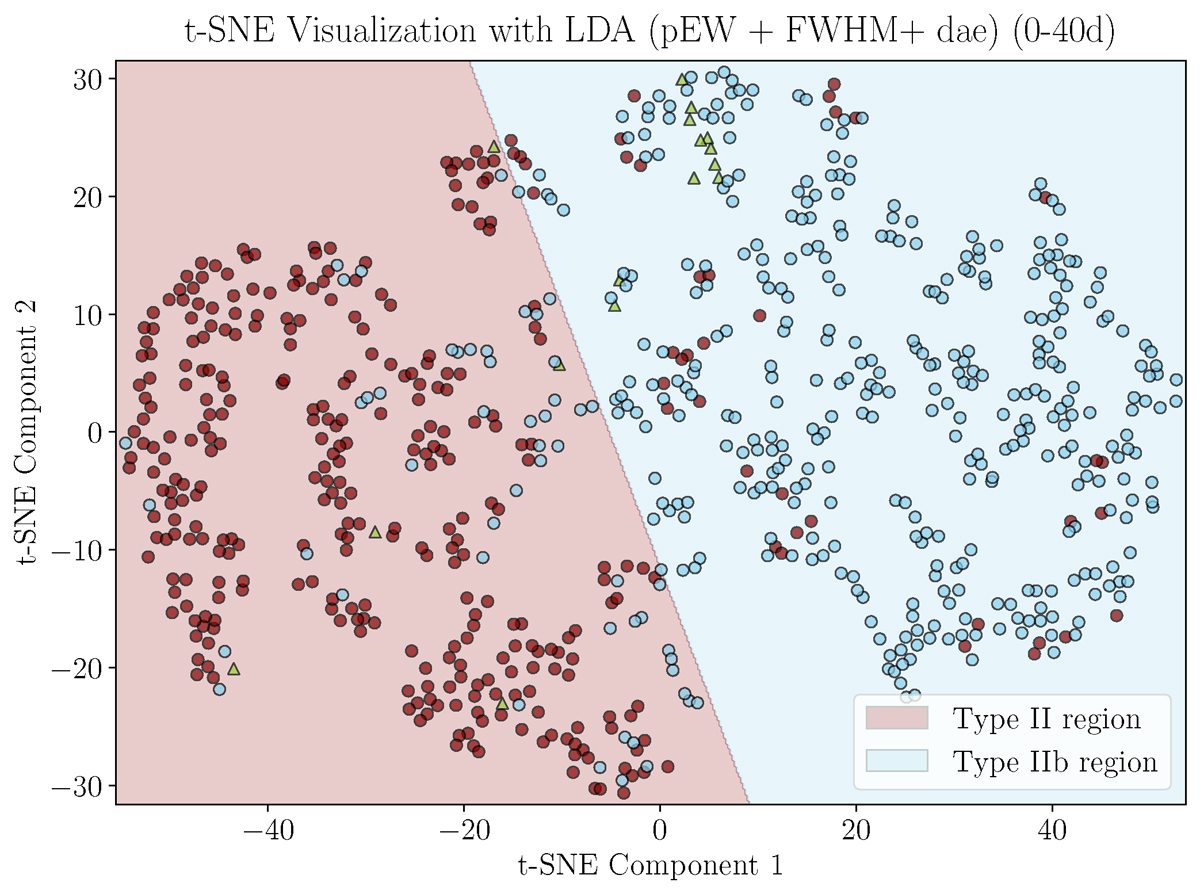
Fig. 10.
Download original image
Resulting t-SNE 2D reduced plot, using a perplexity value of 20. The red and blue dots represent SNe II and IIb, respectively, while green triangles indicate 87A-like events. The figure is separated into two regions defined by the LDA, with the solid line representing the decision boundary found for the t-SNE projection.
Current usage metrics show cumulative count of Article Views (full-text article views including HTML views, PDF and ePub downloads, according to the available data) and Abstracts Views on Vision4Press platform.
Data correspond to usage on the plateform after 2015. The current usage metrics is available 48-96 hours after online publication and is updated daily on week days.
Initial download of the metrics may take a while.