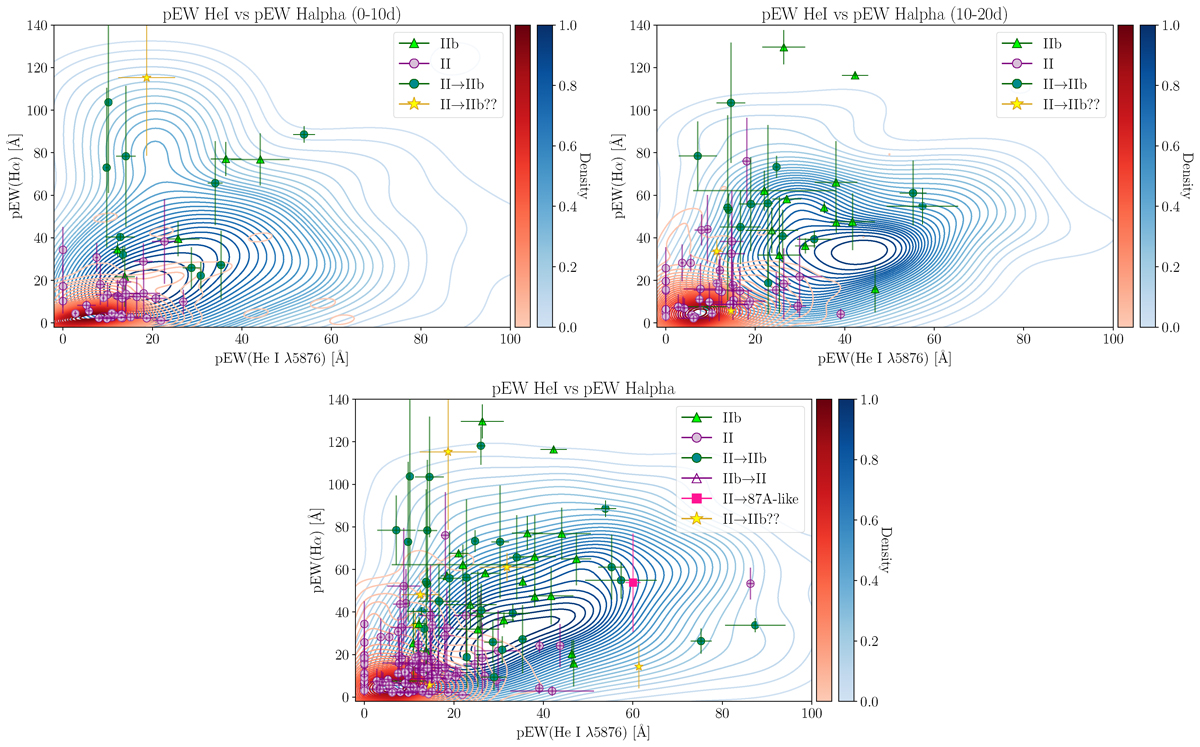
Fig. 12.
Download original image
pEW measurements of Hα and He I for the comparison sample (SEDM plus newly classified SNe) overlaid on the density contours of SNe II (red) and IIb (blue) obtained in Section 4.2.1 (same as Figure 9), for three time intervals: 0–10 days (left), 10–20 days (middle) and 0–40 days (right). The comparison sample is represented by SNe II as filled purple dots and SNe IIb as filled green triangles. Dark green circles correspond to SNe initially classified as type II but exhibiting SNe IIb-like properties. Open purple triangles represent SNe, which were initially classified as type IIb but spectroscopically belong to the SN II class. Pink squares denote SNe II showing 87A-like characteristics. Yellow stars highlight SNe II that appear to exhibit SNe IIb characteristics but lack sufficient data to confirm this classification.
Current usage metrics show cumulative count of Article Views (full-text article views including HTML views, PDF and ePub downloads, according to the available data) and Abstracts Views on Vision4Press platform.
Data correspond to usage on the plateform after 2015. The current usage metrics is available 48-96 hours after online publication and is updated daily on week days.
Initial download of the metrics may take a while.