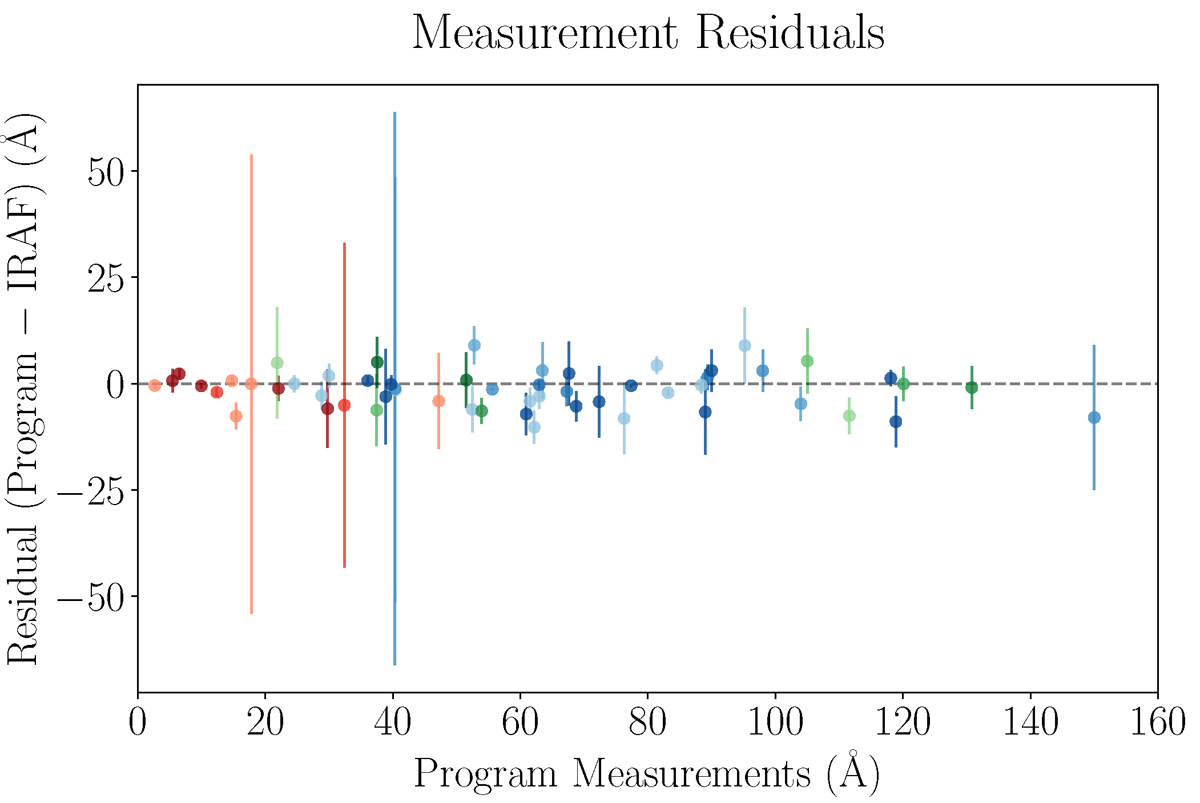
Fig. A.1.
Download original image
Residuals between the pEW and FWHM values measured with our interactive program and those obtained with IRAF are shown as (programme: IRAF) plotted against the programme-derived values. Data points are colour-coded by SN type: SNe II are shown in warm colours, while SNe IIb are in cool tones. Different colours represent different SNe.
Current usage metrics show cumulative count of Article Views (full-text article views including HTML views, PDF and ePub downloads, according to the available data) and Abstracts Views on Vision4Press platform.
Data correspond to usage on the plateform after 2015. The current usage metrics is available 48-96 hours after online publication and is updated daily on week days.
Initial download of the metrics may take a while.