Open Access
Fig. A.2.
Download original image
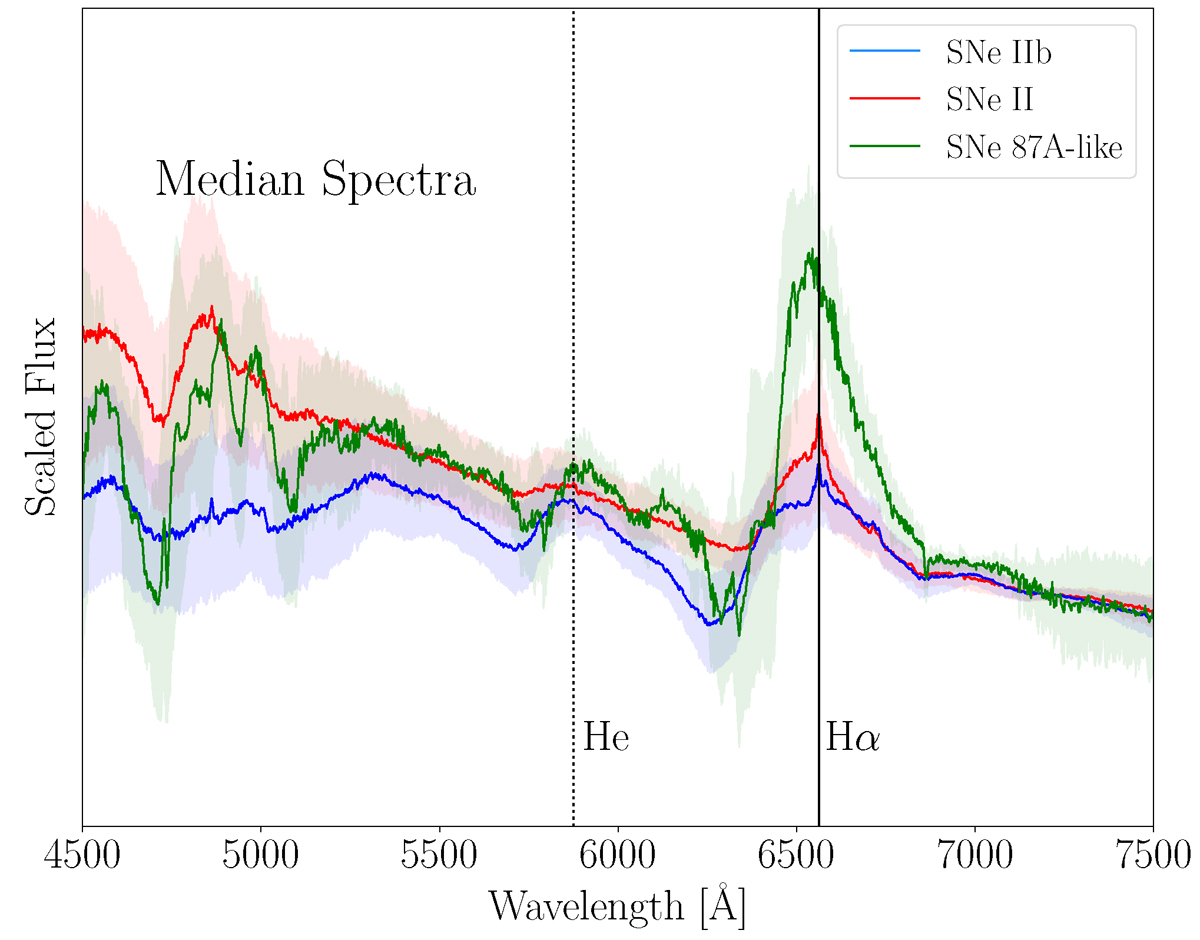
Comparison between the median spectrum for SNe II (red), SNe IIb (blue) and SN 87A-like (green) constructed from all spectra in our sample (from explosion to 40 days post-explosion). The shaded regions represent the Median Absolute Deviation (MAD), providing a measure of dispersion around the median.
Current usage metrics show cumulative count of Article Views (full-text article views including HTML views, PDF and ePub downloads, according to the available data) and Abstracts Views on Vision4Press platform.
Data correspond to usage on the plateform after 2015. The current usage metrics is available 48-96 hours after online publication and is updated daily on week days.
Initial download of the metrics may take a while.