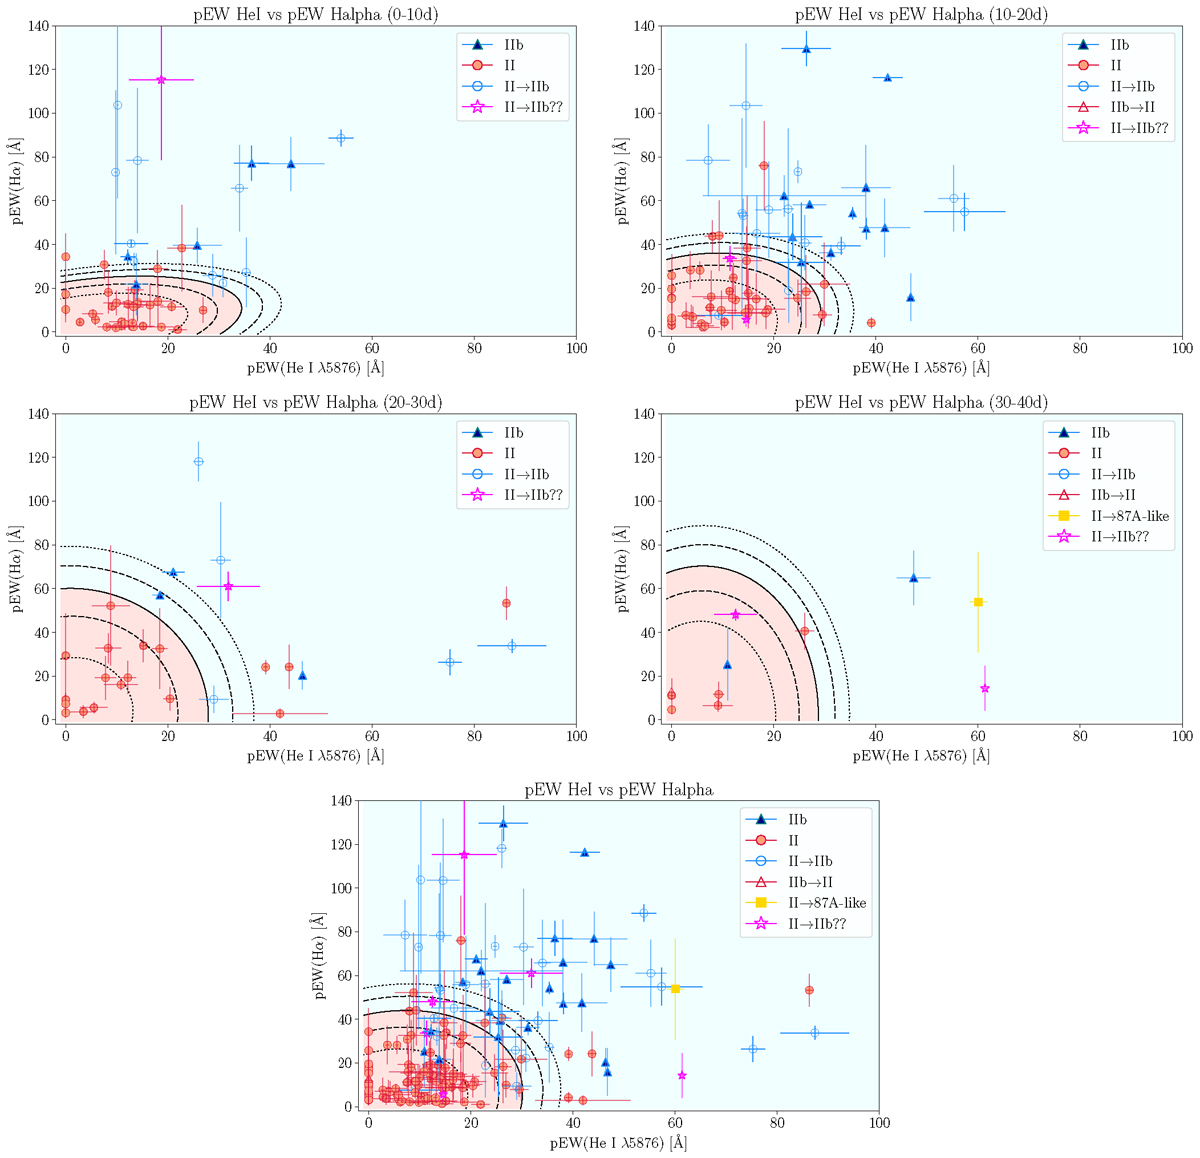
Fig. A.9.
Download original image
Ranges defined by QDA based on the measures performed for the II and IIb pEW along with the SEDM and the new classified SNe. The closed red dots mark the type II data points, the closed blue triangles the type IIb and the yellow square a 87A-like. The open markers are those that have been reclassified based on our method. So the open blue circles belong to the SNe that were first classified as type II and then reclassified as IIb. The open red triangles are those first classified as IIb and then reclassified as II in this work. The purple open stars are SNe classified as II that seem to exhibit characteristics of IIb but could not be confirmed. In Table B.2, we present the SNe included in the plots, together with their previous and updated classifications.
Current usage metrics show cumulative count of Article Views (full-text article views including HTML views, PDF and ePub downloads, according to the available data) and Abstracts Views on Vision4Press platform.
Data correspond to usage on the plateform after 2015. The current usage metrics is available 48-96 hours after online publication and is updated daily on week days.
Initial download of the metrics may take a while.