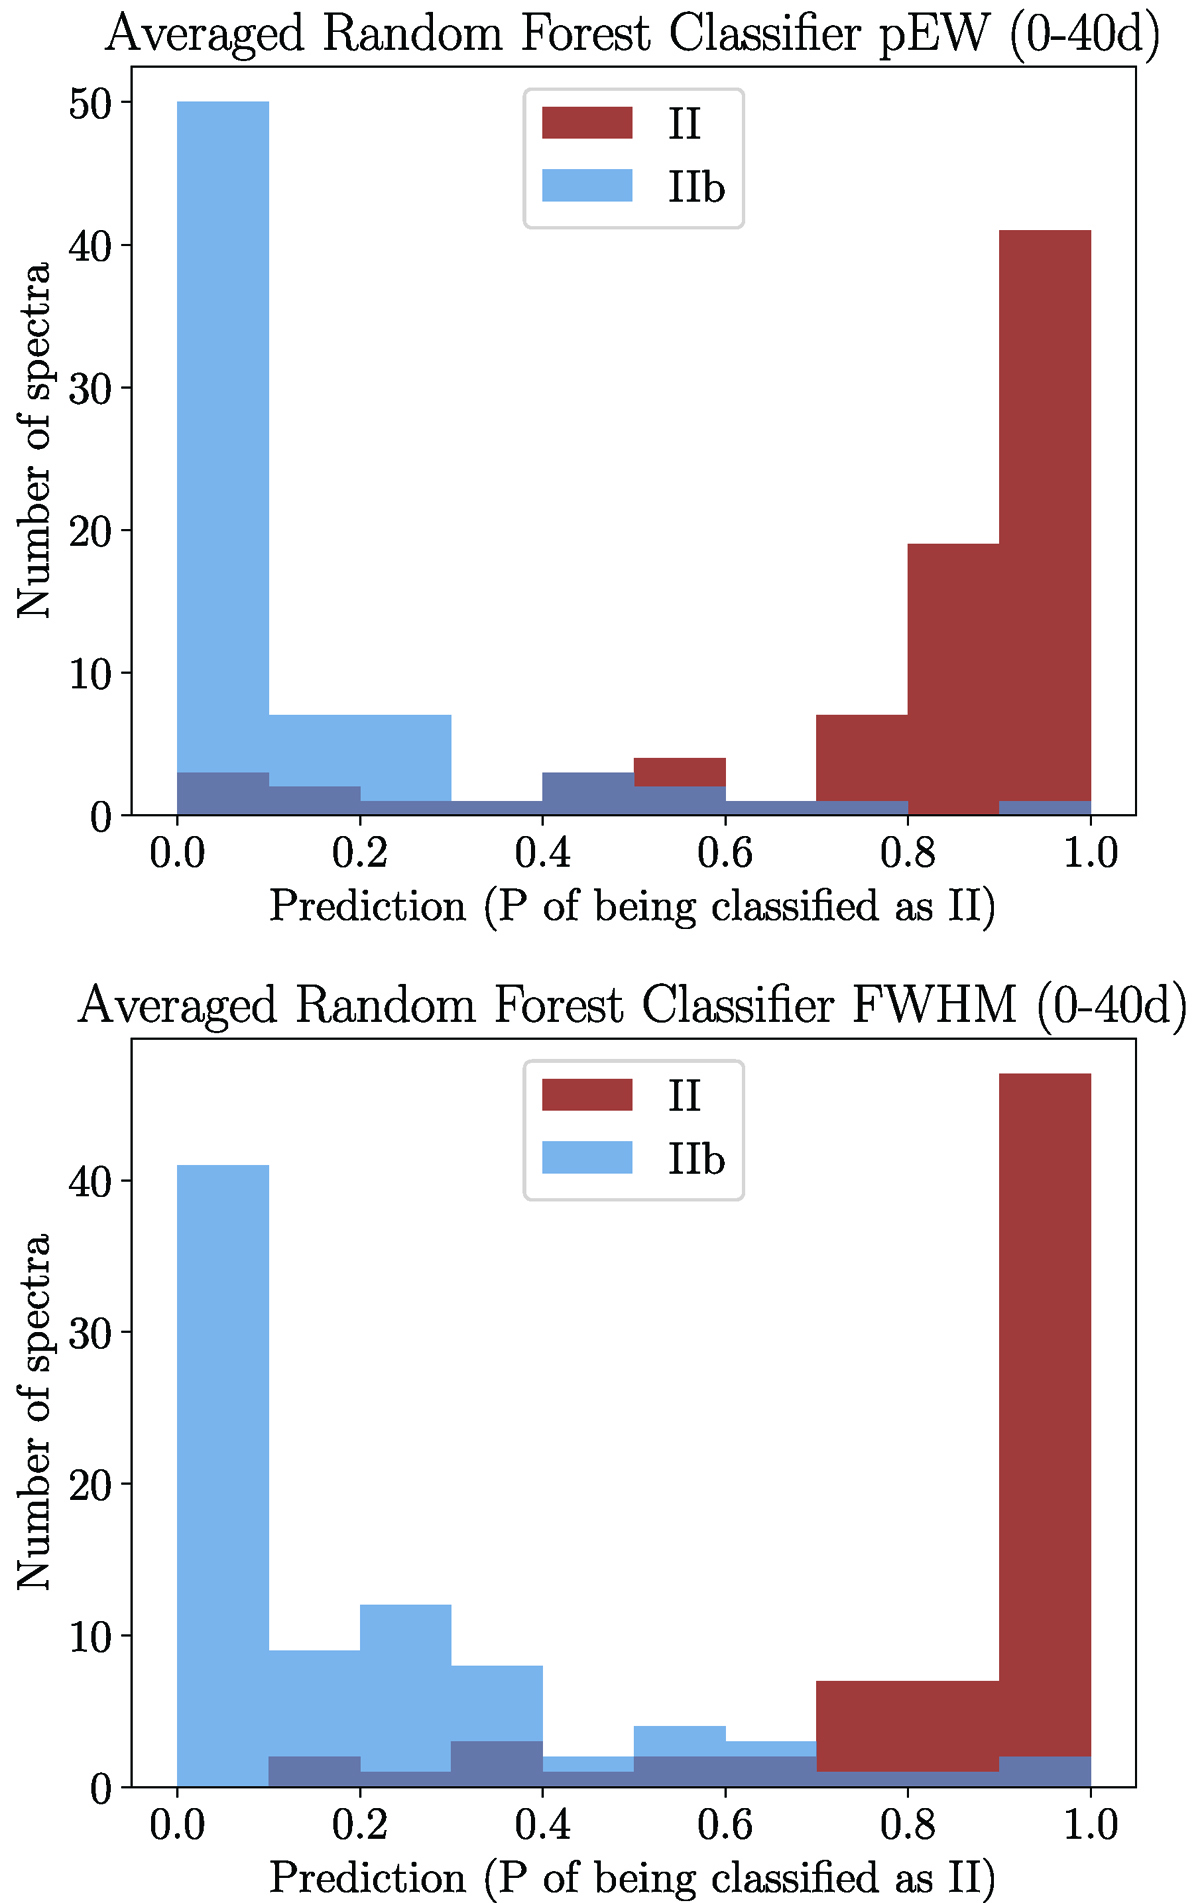
Fig. A.14.
Download original image
Left panel: Probabilities given by the RFC for the whole sample, taking into account the pEW measurements for all the spectra within the first 40 days after the explosion the SN, using %60 of the total sample as training sample and the rest as test sample. Right panel: Probabilities given by the RFC for the whole sample, taking into account only the FWHM measurements for all the spectra within the first 40 days after the explosion, using %60 of the total sample as training sample and the rest as test sample. The red and blue bins correspond to SNe II and IIb, respectively.
Current usage metrics show cumulative count of Article Views (full-text article views including HTML views, PDF and ePub downloads, according to the available data) and Abstracts Views on Vision4Press platform.
Data correspond to usage on the plateform after 2015. The current usage metrics is available 48-96 hours after online publication and is updated daily on week days.
Initial download of the metrics may take a while.