Open Access
Fig. 3.
Download original image
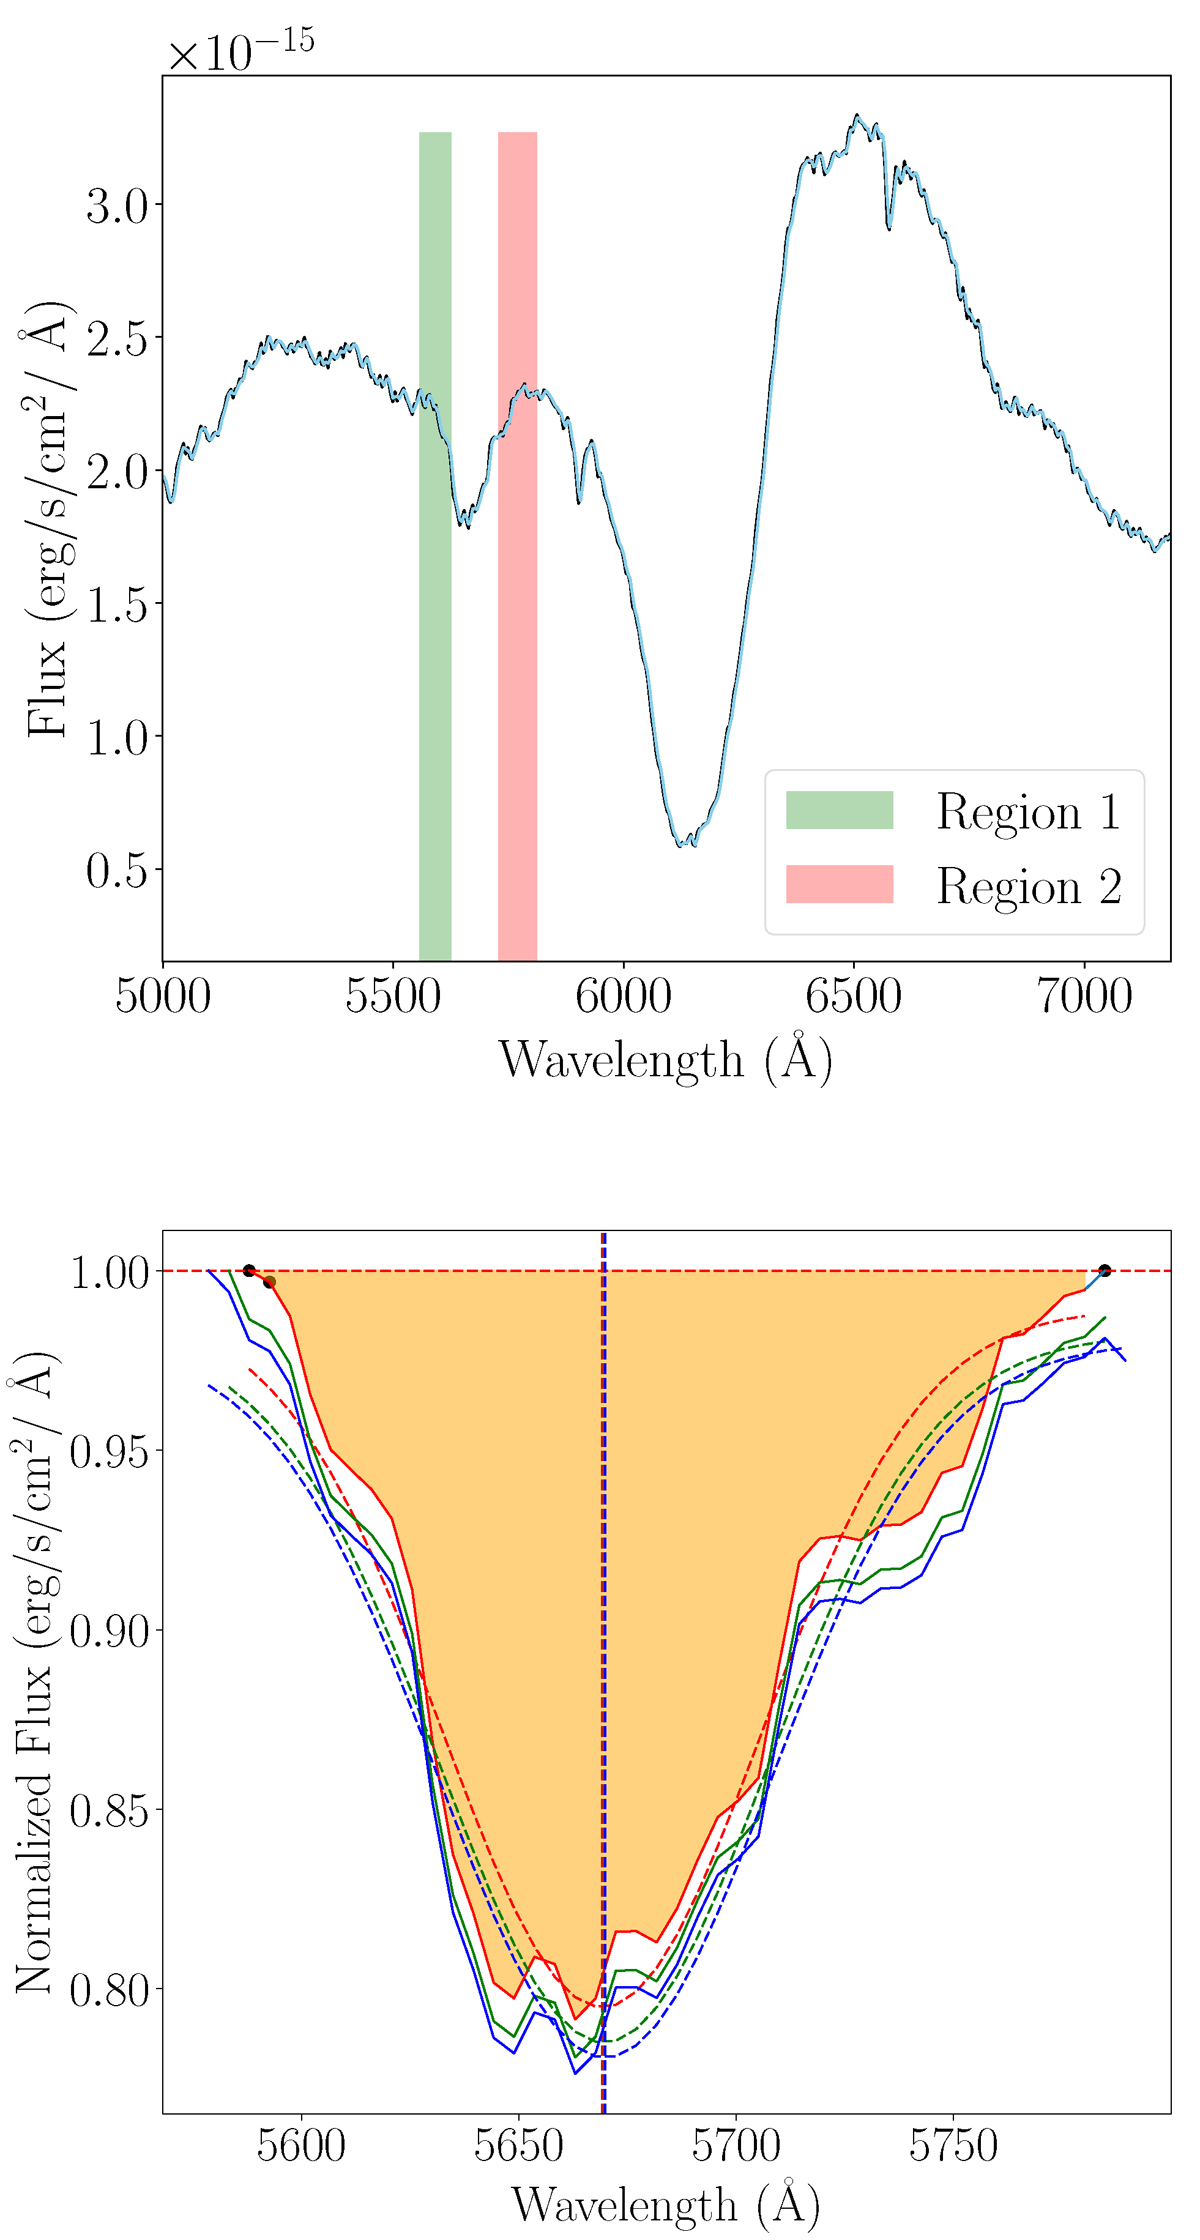
Example of the pEW and FWHM measurement for the He I line. Top: Selection of the two regions to define the line to be measured. Bottom: Defined line and the Gaussian fitting for the pEW and FWHM computation. The different line colours represent the shifted measurements used to estimate the uncertainties.
Current usage metrics show cumulative count of Article Views (full-text article views including HTML views, PDF and ePub downloads, according to the available data) and Abstracts Views on Vision4Press platform.
Data correspond to usage on the plateform after 2015. The current usage metrics is available 48-96 hours after online publication and is updated daily on week days.
Initial download of the metrics may take a while.