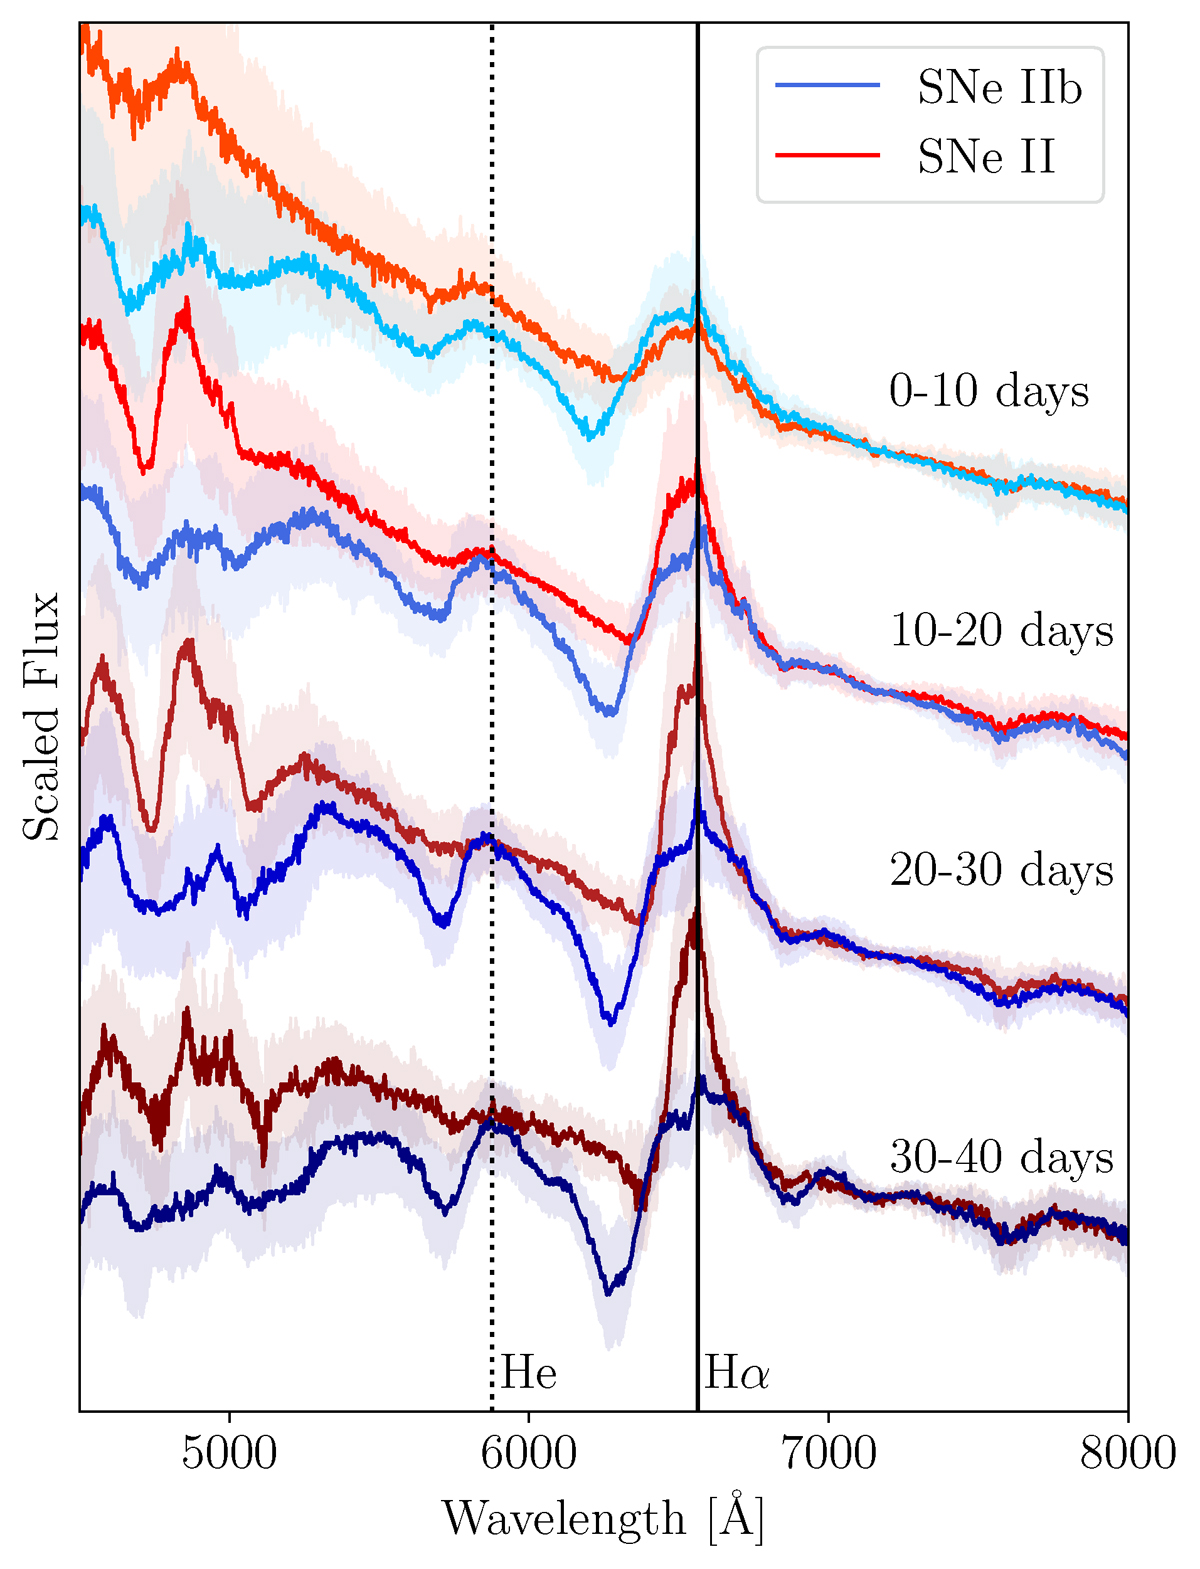
Fig. 5.
Download original image
Comparison between the median spectra of SNe II and IIb in different time ranges: 0–10 days post-explosion, 10–20 days, 20–30 days and 30–40 days. Blue spectra correspond to SNe IIb, and red spectra to SNe II. The dashed vertical line marks the rest wavelength of He I (λ5876), while the continuous line marks the rest wavelength of Hα. The shaded regions represent the Median Absolute Deviation (MAD), which represents dispersion around the median.
Current usage metrics show cumulative count of Article Views (full-text article views including HTML views, PDF and ePub downloads, according to the available data) and Abstracts Views on Vision4Press platform.
Data correspond to usage on the plateform after 2015. The current usage metrics is available 48-96 hours after online publication and is updated daily on week days.
Initial download of the metrics may take a while.