Fig. 6.
Download original image
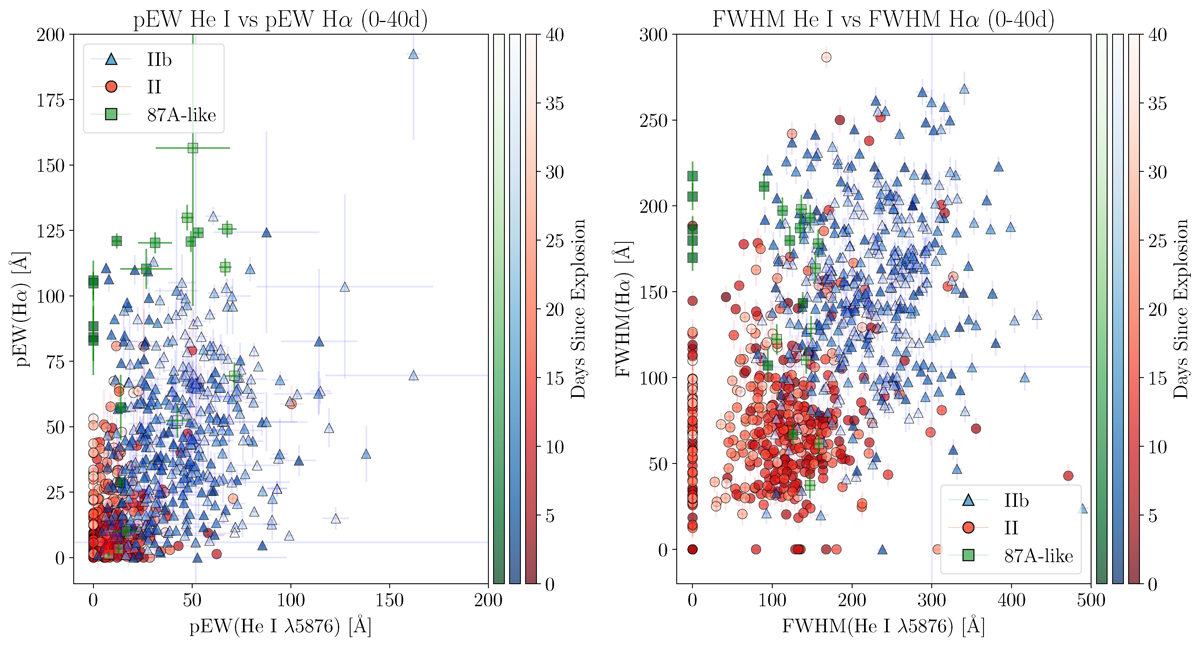
Left panel: pEW of the Hα absorption profile versus the pEW of the He I λ5876 line measured across the full-time interval (0–40 days). The markers are established by SN type: SNe IIb are shown as blue triangles, SNe II as red circles, and SNe 87A-like as green squares. The colour bars on the right side indicate the SN phase. Right panel: Same as the left panel, but for the FWHM measurements.
Current usage metrics show cumulative count of Article Views (full-text article views including HTML views, PDF and ePub downloads, according to the available data) and Abstracts Views on Vision4Press platform.
Data correspond to usage on the plateform after 2015. The current usage metrics is available 48-96 hours after online publication and is updated daily on week days.
Initial download of the metrics may take a while.