Open Access
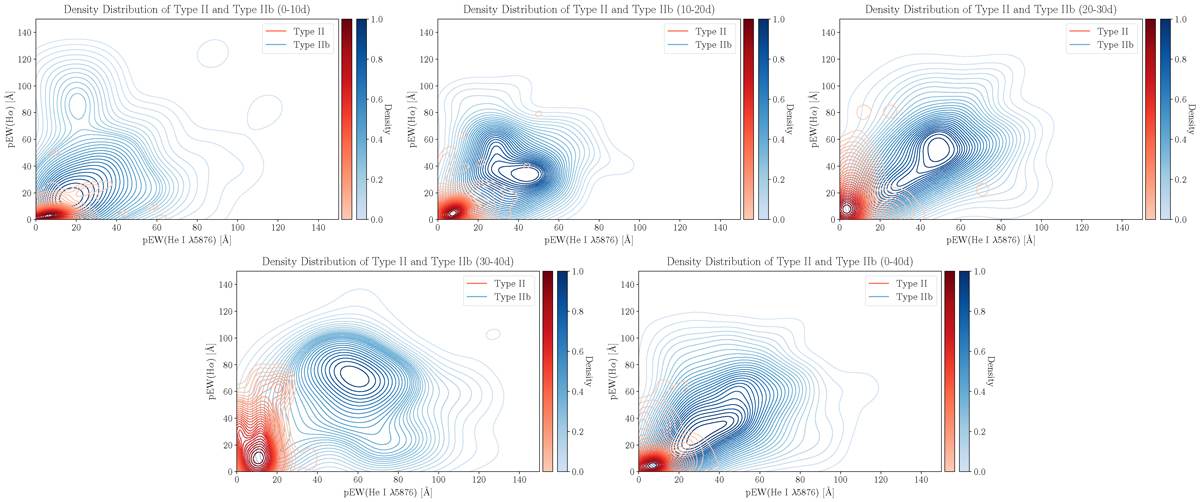
Fig. 8.
Download original image
Density contours of SNe II (in red) and IIb (in blue) based on the pEW measurements. The colour bars on the right side indicate the normalised density values, with darker colours representing higher densities. Each plot represents the density contours at different time intervals, as indicated at the top of the figure.
Current usage metrics show cumulative count of Article Views (full-text article views including HTML views, PDF and ePub downloads, according to the available data) and Abstracts Views on Vision4Press platform.
Data correspond to usage on the plateform after 2015. The current usage metrics is available 48-96 hours after online publication and is updated daily on week days.
Initial download of the metrics may take a while.