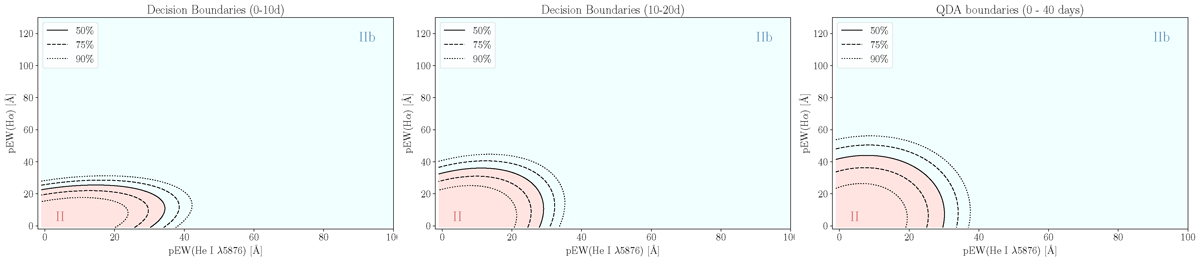
Fig. 9.
Download original image
Decision boundaries defined by the QDA classifier based on the pEW measurements for SN II and IIb pEW are shown across three time intervals: 0–10 days (left), 10–20 days (middle) and 0–40 days after the explosion (right). The red region corresponds to predictions for SNe II, while the blue region represents SNe IIb. The decision regions with a filled contour indicate where the model assigns a given SN type. Black contour lines represent classification probability thresholds, with a solid line marking a 50% probability, dashed lines for 75%, and a dotted line for 90% of belonging to a specific class.
Current usage metrics show cumulative count of Article Views (full-text article views including HTML views, PDF and ePub downloads, according to the available data) and Abstracts Views on Vision4Press platform.
Data correspond to usage on the plateform after 2015. The current usage metrics is available 48-96 hours after online publication and is updated daily on week days.
Initial download of the metrics may take a while.