Fig. 11
Download original image
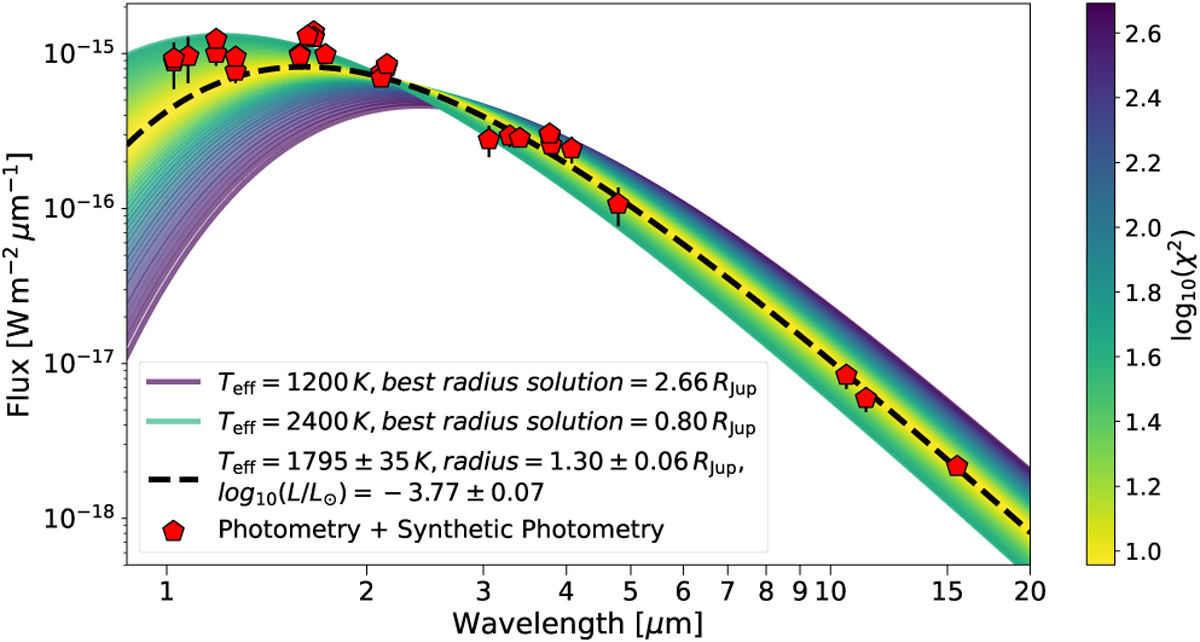
SED of κ And b and the blackbody fitting results. The red circles correspond to observed photometry and calculated photometry from spectra observations (synthetic photometry). The colored lines correspond to the black body fit with temperatures from 1200 K to 2400 K (fixed) and the respective best-fit radius. The color gradient corresponds to the goodness-of-fit. The dashed black line corresponds to the best-fit model (temperature and radius as free parameters).
Current usage metrics show cumulative count of Article Views (full-text article views including HTML views, PDF and ePub downloads, according to the available data) and Abstracts Views on Vision4Press platform.
Data correspond to usage on the plateform after 2015. The current usage metrics is available 48-96 hours after online publication and is updated daily on week days.
Initial download of the metrics may take a while.