Fig. 12
Download original image
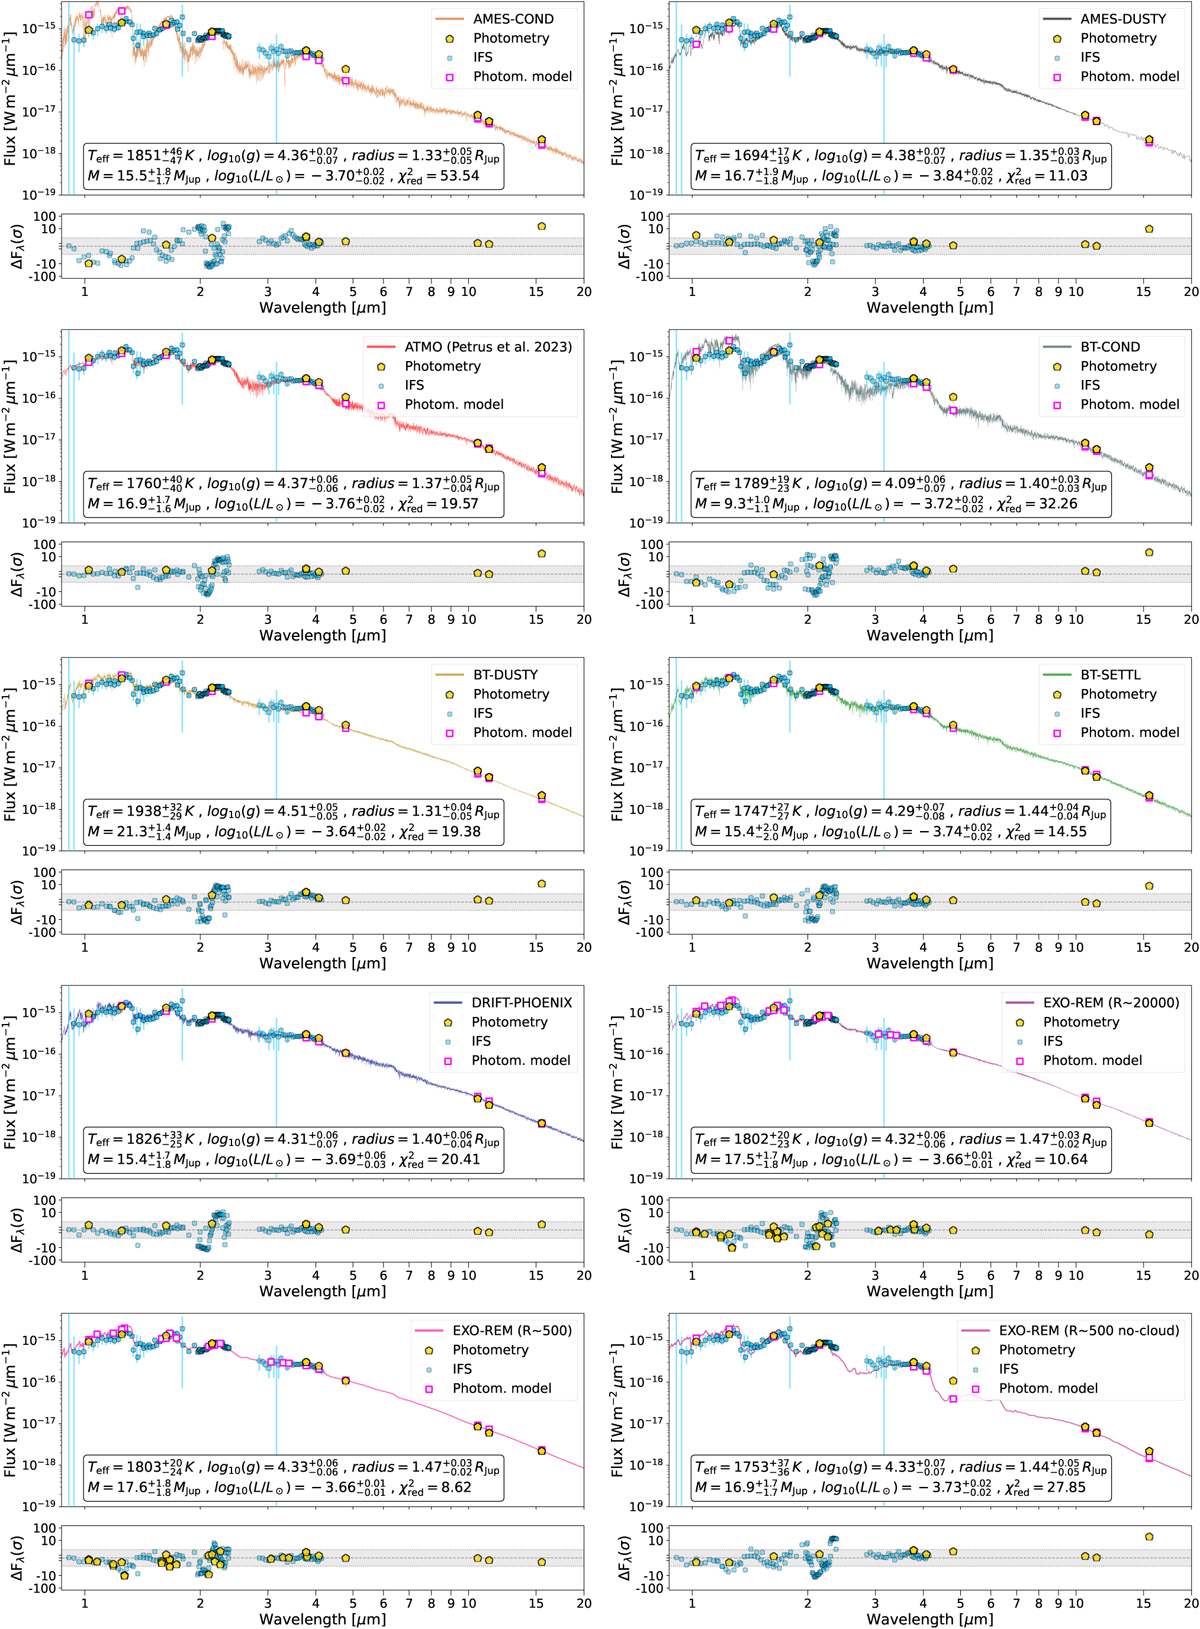
Best-fit results from different atmospheric models. Each panel shows the best-fit model from a different combination of datasets, selected from all possible combinations. Each panel shows the photometric data (yellow pentagons), IFS (cyan circles), photometry from atmospheric model (magenta squares), and the best-fit model (colored line), and the residuals are shown in the bottom panel. Table 7 shows the data subset that corresponds to the best fit for each atmospheric model.
Current usage metrics show cumulative count of Article Views (full-text article views including HTML views, PDF and ePub downloads, according to the available data) and Abstracts Views on Vision4Press platform.
Data correspond to usage on the plateform after 2015. The current usage metrics is available 48-96 hours after online publication and is updated daily on week days.
Initial download of the metrics may take a while.