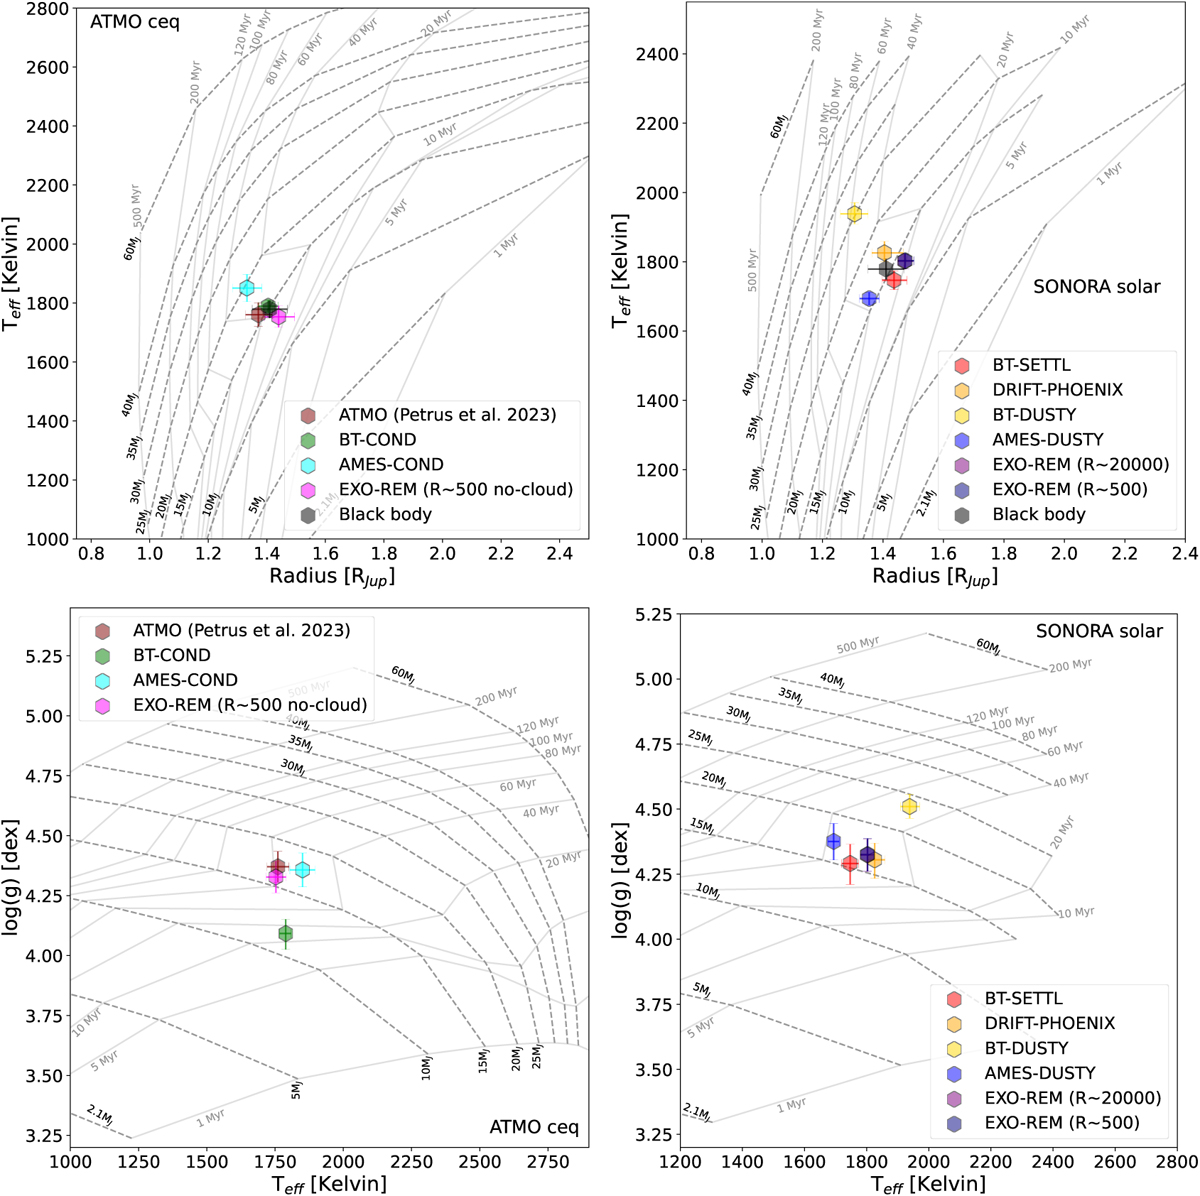
Fig. 13
Download original image
Evolutionary tracks showing the age (continuum gray lines) and the mass (dashed dark gray lines) for a cloudy (Sonora with solar metallicity, right panels), and a cloud-free model (ATMO chemical equilibrium, left panels). Top: evolutionary tracks using the radius and effective temperature. Bottom: evolutionary tracks using effective temperature and log(g). The differently colored pentagons correspond to the values obtained from the atmospheric models.
Current usage metrics show cumulative count of Article Views (full-text article views including HTML views, PDF and ePub downloads, according to the available data) and Abstracts Views on Vision4Press platform.
Data correspond to usage on the plateform after 2015. The current usage metrics is available 48-96 hours after online publication and is updated daily on week days.
Initial download of the metrics may take a while.