Fig. 16
Download original image
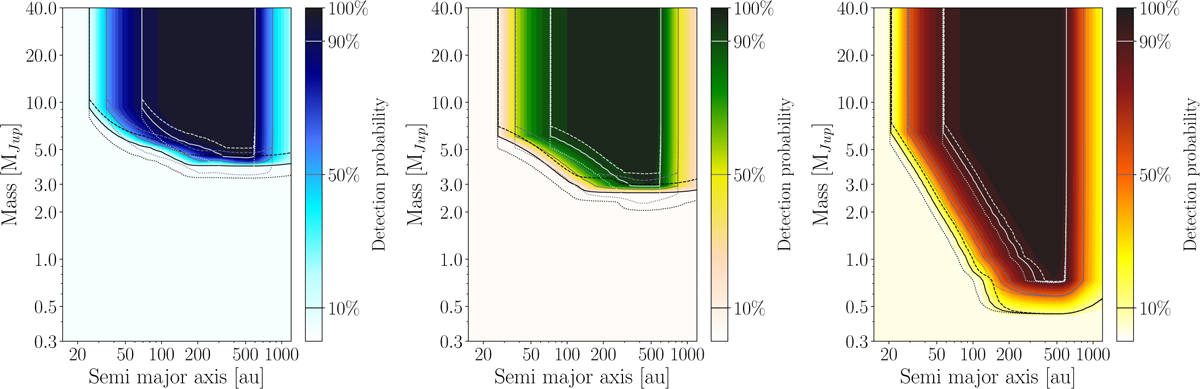
Sensitivity of JWST/MIRI observations using the ATMO chemical equilibrium evolutionary track and an age of 47 ± 7 Myr. From left to right: F1065C, F1140C, and F1550C. The color bar in each plot means the detection probability, and the solid lines highlight the 10%, 50%, and 90% detection thresholds. The dotted and dashed lines correspond to 1σ uncertainties, respectively.
Current usage metrics show cumulative count of Article Views (full-text article views including HTML views, PDF and ePub downloads, according to the available data) and Abstracts Views on Vision4Press platform.
Data correspond to usage on the plateform after 2015. The current usage metrics is available 48-96 hours after online publication and is updated daily on week days.
Initial download of the metrics may take a while.