Fig. A.3
Download original image
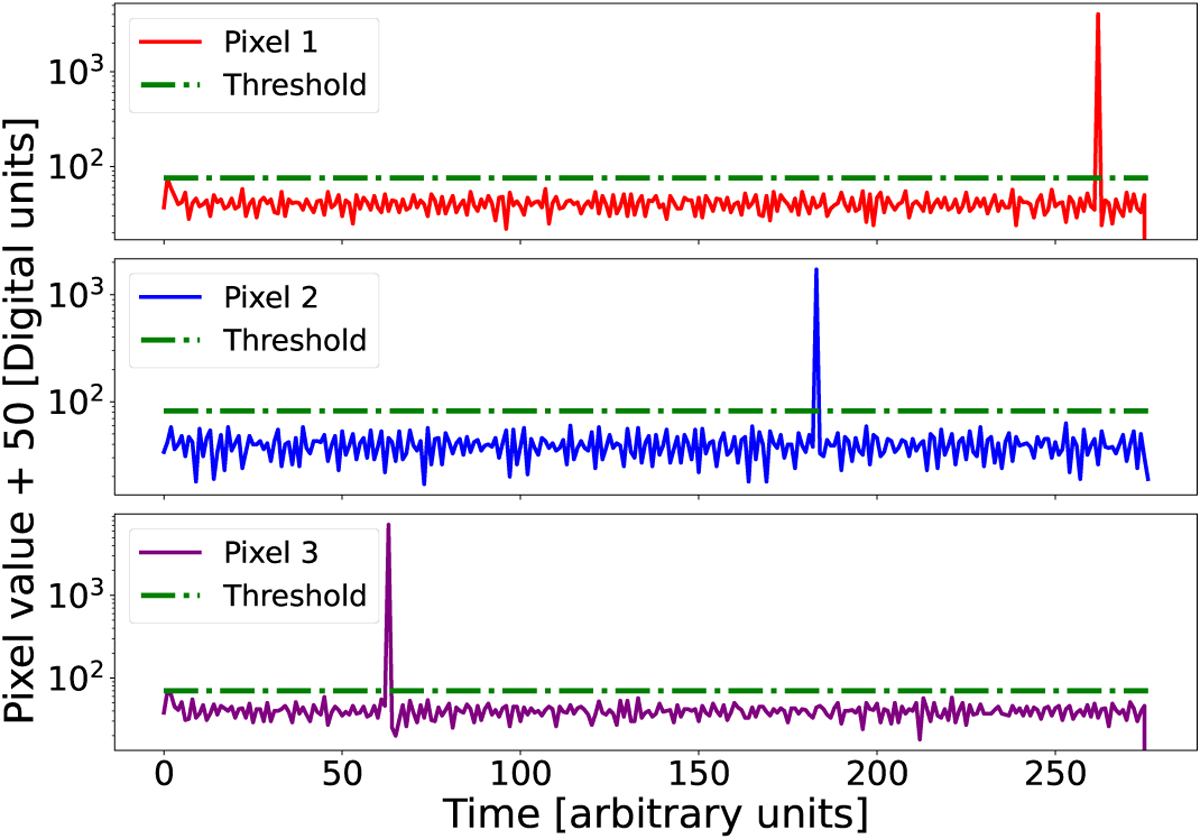
Flux difference between consecutive groups for each selected pixel affected by a cosmic ray. The red, blue, and purple curves correspond to each pixel flux as a function of time. The dashed green line corresponds to the threshold used to select outliers. The cosmic ray hit appears as a peak in each flux-differentiation ramp.
Current usage metrics show cumulative count of Article Views (full-text article views including HTML views, PDF and ePub downloads, according to the available data) and Abstracts Views on Vision4Press platform.
Data correspond to usage on the plateform after 2015. The current usage metrics is available 48-96 hours after online publication and is updated daily on week days.
Initial download of the metrics may take a while.