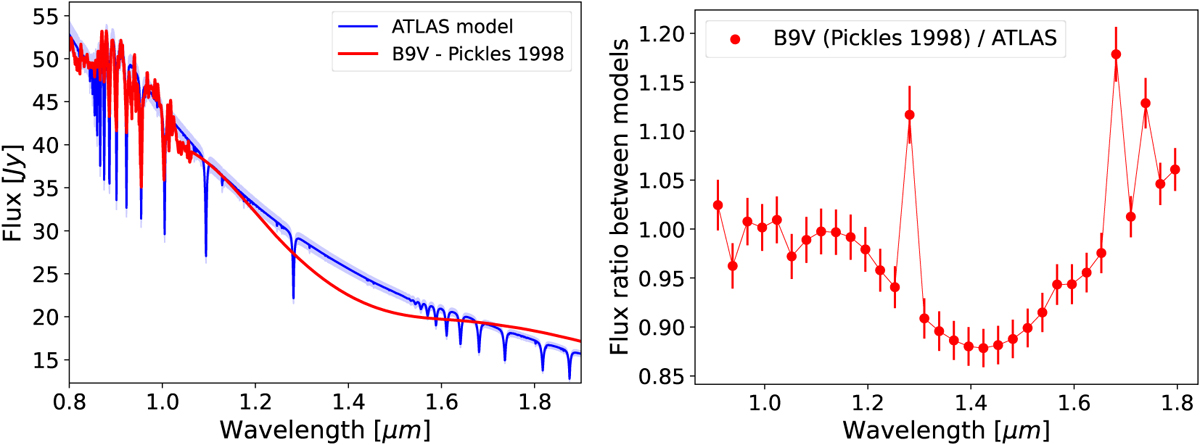
Fig. E.2
Download original image
Synthetic stellar spectrum (blue line) and the B9V Pickles library spectrum (red line) used to convert the companion contrast into flux (Hinkley et al. 2013). Left: Two stellar model spectra in the wavelength range of the IFS observation. Right: Ratio of the two model spectra at the resolution of the IFS observation. This ratio corresponds to the corrector factor.
Current usage metrics show cumulative count of Article Views (full-text article views including HTML views, PDF and ePub downloads, according to the available data) and Abstracts Views on Vision4Press platform.
Data correspond to usage on the plateform after 2015. The current usage metrics is available 48-96 hours after online publication and is updated daily on week days.
Initial download of the metrics may take a while.