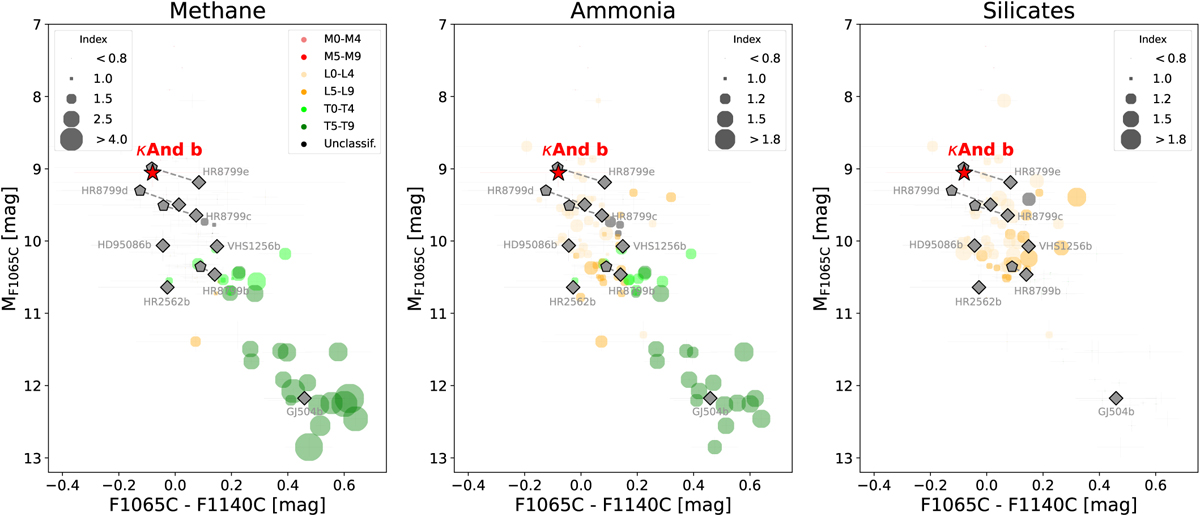
Fig. 9
Download original image
CMD using the F1065C ad F1140C filters from MIRI. The dots correspond to the photometry obtained from the Spitzer spectra sample (Suárez & Metchev 2022), while the colors refer to the spectral type. The subplots correspond to the same CMD but show the methane (left), ammonia (middle), and silicates (right) spectral indices, as defined in Suárez & Metchev (2022), related to the depth of the absorption feature of each component. The circle sizes in each subplot refer to the value of the spectral index, as defined by Suárez & Metchev (2022). The gray dots in each panel correspond to species non-detection (i.e., plotted with index=0, not highlighted sources). The black dots refer to unclassified spectral types. The red star corresponds to κ And b, while the gray diamonds correspond to known planetary-mass companions (HR 2562 b from Godoy et al. 2024; VHS 1256 b from Miles et al. 2023; HD 95086 b from Mâlin et al. 2024; GJ 504 b from Mâlin et al. 2025; HR 8799 bcde from Boccaletti et al. 2024). The location and size of each planetary-mass companion are not related to the spectral index. Note that the Y-axis (i.e., MF1065C) refers to the absolute magnitude. Sample data taken from Godoy et al. (2024).
Current usage metrics show cumulative count of Article Views (full-text article views including HTML views, PDF and ePub downloads, according to the available data) and Abstracts Views on Vision4Press platform.
Data correspond to usage on the plateform after 2015. The current usage metrics is available 48-96 hours after online publication and is updated daily on week days.
Initial download of the metrics may take a while.