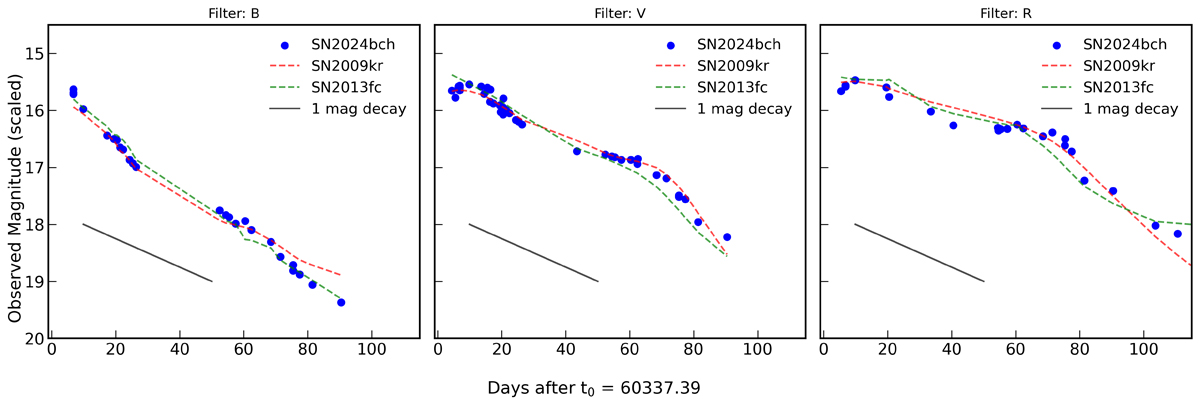
Fig. 4.
Download original image
Comparison of the BVR light curves of SN 2024bch (blue dots) with those of SN 2009kr and SN 2013fc (dashed red and green curves, respectively). The data for SN 2009kr and SN 2013fc are scaled to match SN 2024bch and interpolated over the same time interval using GP interpolation (see the main text for details). Additionally, we show a reference curve representing a decay of 1 magnitude between tmax and t50.
Current usage metrics show cumulative count of Article Views (full-text article views including HTML views, PDF and ePub downloads, according to the available data) and Abstracts Views on Vision4Press platform.
Data correspond to usage on the plateform after 2015. The current usage metrics is available 48-96 hours after online publication and is updated daily on week days.
Initial download of the metrics may take a while.