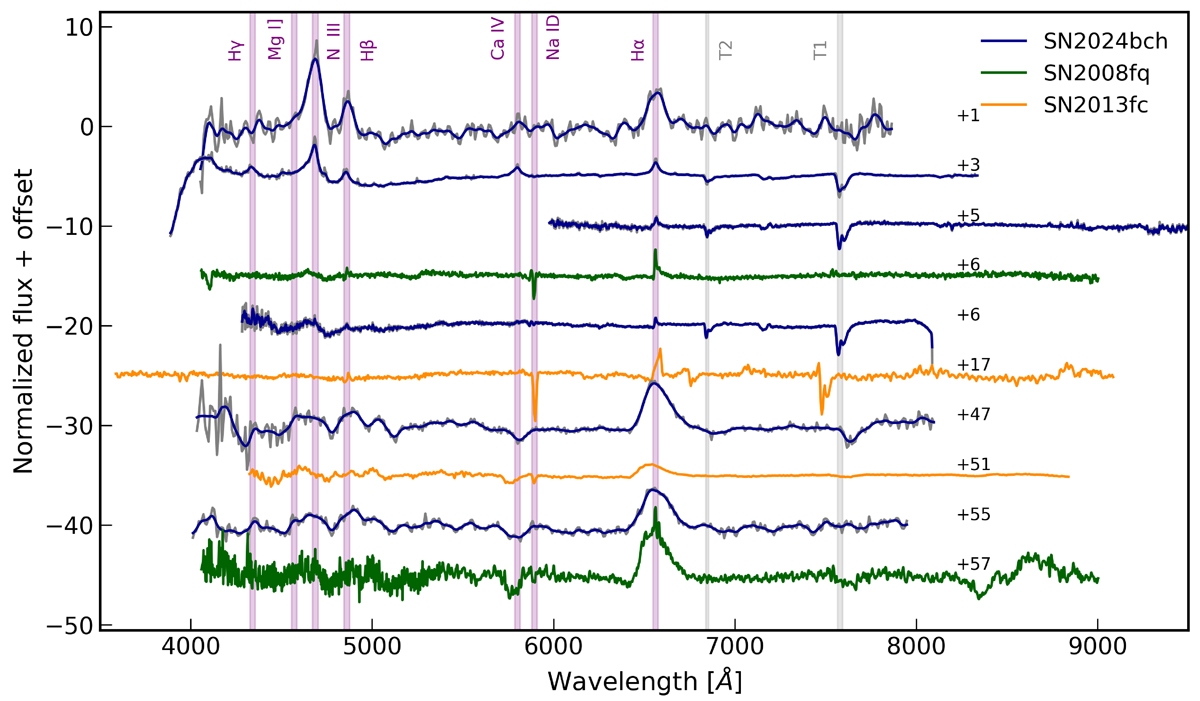
Fig. 5.
Download original image
Spectra of SN 2024bch compared with two spectra of SN 2013fc (at 17 and 51 days post-explosion) and two spectra of SN 2008fq (at 6 and 57 days post-explosion). We removed the continuum from every spectrum and normalized to order zero. We added an offset for better visualization. The main spectral features of SN 2024bch are highlighted as purple-shaded vertical bands. Telluric lines are identified as “T1” and “T2” (gray bands). The spectrum taken with LT is the second from the bottom of the SN 2024bch spectra, at 47 days post-explosion. The other spectral data for the three SNe are taken from WISeREP (Yaron & Gal-Yam 2012).
Current usage metrics show cumulative count of Article Views (full-text article views including HTML views, PDF and ePub downloads, according to the available data) and Abstracts Views on Vision4Press platform.
Data correspond to usage on the plateform after 2015. The current usage metrics is available 48-96 hours after online publication and is updated daily on week days.
Initial download of the metrics may take a while.