Fig. 1.
Download original image
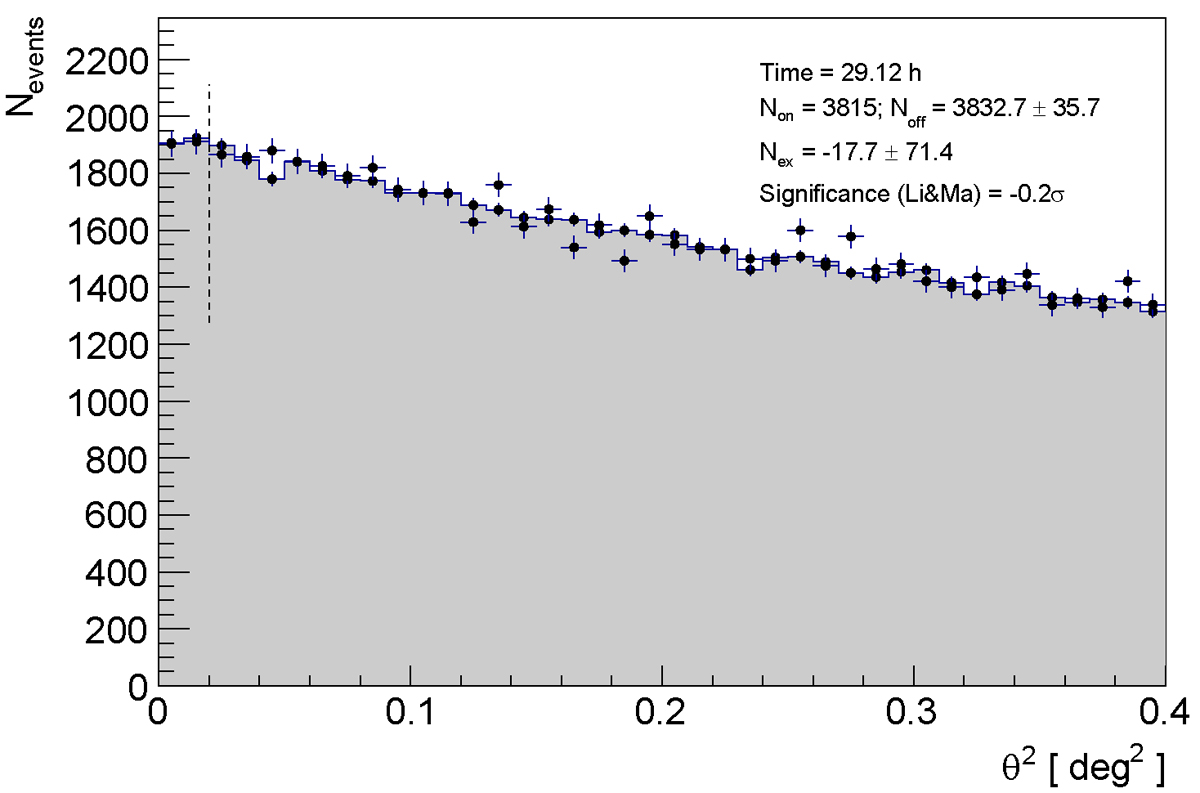
Squared angular distance (θ2) to the NGC 4151 position distribution showing the number of gamma-ray candidate events as a function of the squared angular separation between the reconstructed gamma-ray direction and the NGC 4151 position. The distribution of θ2, defined relative to the position of NGC 4151, is indicated with the black points, while the gray histogram corresponds to the θ2 distribution defined relative to one of the background estimation points (Fomin et al. 1994). The vertical dashed line defines the signal region within which the detection significance is computed.
Current usage metrics show cumulative count of Article Views (full-text article views including HTML views, PDF and ePub downloads, according to the available data) and Abstracts Views on Vision4Press platform.
Data correspond to usage on the plateform after 2015. The current usage metrics is available 48-96 hours after online publication and is updated daily on week days.
Initial download of the metrics may take a while.