| Issue |
A&A
Volume 702, October 2025
|
|
|---|---|---|
| Article Number | A38 | |
| Number of page(s) | 9 | |
| Section | Extragalactic astronomy | |
| DOI | https://doi.org/10.1051/0004-6361/202554723 | |
| Published online | 03 October 2025 | |
Very high energy observations of the Seyfert galaxy NGC 4151 with MAGIC
Indication of another gamma-ray obscured candidate neutrino source
1
Japanese MAGIC Group: Department of Physics, Tokai University, Hiratsuka, 259-1292 Kanagawa, Japan
2
Japanese MAGIC Group: Institute for Cosmic Ray Research (ICRR), The University of Tokyo, Kashiwa, 277-8582 Chiba, Japan
3
ETH Zürich, CH-8093 Zürich, Switzerland
4
Università di Siena and INFN Pisa, I-53100 Siena, Italy
5
Institut de Física d’Altes Energies (IFAE), The Barcelona Institute of Science and Technology (BIST), E-08193 Bellaterra, (Barcelona), Spain
6
Universitat de Barcelona, ICCUB, IEEC-UB, E-08028 Barcelona, Spain
7
Instituto de Astrofísica de Andalucía-CSIC, Glorieta de la Astronomía s/n, 18008 Granada, Spain
8
National Institute for Astrophysics (INAF), I-00136 Rome, Italy
9
Università di Udine and INFN Trieste, I-33100 Udine, Italy
10
Max-Planck-Institut für Physik, D-85748 Garching, Germany
11
Università di Padova and INFN, I-35131 Padova, Italy
12
Instituto de Astrofísica de Canarias and Dpto. de Astrofísica, Universidad de La Laguna, E-38200 La Laguna, Tenerife, Spain
13
Croatian MAGIC Group: University of Zagreb, Faculty of Electrical Engineering and Computing (FER), 10000 Zagreb, Croatia
14
Saha Institute of Nuclear Physics, A CI of Homi Bhabha National Institute, Kolkata, 700064 West Bengal, India
15
Centro Brasileiro de Pesquisas Físicas (CBPF), 22290-180 URCA, Rio de Janeiro (RJ), Brazil
16
IPARCOS Institute and EMFTEL Department, Universidad Complutense de Madrid, E-28040 Madrid, Spain
17
University of Lodz, Faculty of Physics and Applied Informatics, Department of Astrophysics, 90-236 Lodz, Poland
18
Centro de Investigaciones Energéticas, Medioambientales y Tecnológicas, E-28040 Madrid, Spain
19
Departament de Física, and CERES-IEEC, Universitat Autònoma de Barcelona, E-08193 Bellaterra, Spain
20
Università di Pisa and INFN Pisa, I-56126 Pisa, Italy
21
INFN MAGIC Group: INFN Sezione di Bari and Dipartimento Interateneo di Fisica dell’Università e del Politecnico di Bari, I-70125 Bari, Italy
22
Department for Physics and Technology, University of Bergen, Bergen, Norway
23
INFN MAGIC Group: INFN Sezione di Torino and Università degli Studi di Torino, I-10125 Torino, Italy
24
Croatian MAGIC Group: University of Rijeka, Faculty of Physics, 51000 Rijeka, Croatia
25
Universität Würzburg, D-97074 Würzburg, Germany
26
Technische Universität Dortmund, D-44221 Dortmund, Germany
27
Japanese MAGIC Group: Physics Program, Graduate School of Advanced Science and Engineering, Hiroshima University, 739-8526 Hiroshima, Japan
28
Deutsches Elektronen-Synchrotron (DESY), D-15738 Zeuthen, Germany
29
Armenian MAGIC Group: ICRANet-Armenia, 0019 Yerevan, Armenia
30
Croatian MAGIC Group: University of Split, Faculty of Electrical Engineering, Mechanical Engineering and Naval Architecture (FESB), 21000 Split, Croatia
31
Croatian MAGIC Group: Josip Juraj Strossmayer University of Osijek, Department of Physics, 31000 Osijek, Croatia
32
Finnish MAGIC Group: Finnish Centre for Astronomy with ESO, Department of Physics and Astronomy, University of Turku, FI-20014 Turku, Finland
33
University of Geneva, Chemin d’Ecogia 16, CH-1290 Versoix, Switzerland
34
Inst. for Nucl. Research and Nucl. Energy, Bulgarian Academy of Sciences, BG-1784 Sofia, Bulgaria
35
INFN MAGIC Group: INFN Sezione di Catania and Dipartimento di Fisica e Astronomia, University of Catania, I-95123 Catania, Italy
36
Japanese MAGIC Group: Department of Physics, Yamagata University, Yamagata, 990-8560
Japan
37
Finnish MAGIC Group: Space Physics and Astronomy Research Unit, University of Oulu, FI-90014 Oulu, Finland
38
Japanese MAGIC Group: Chiba University, ICEHAP, 263-8522 Chiba, Japan
39
Japanese MAGIC Group: Institute for Space-Earth Environmental Research and Kobayashi-Maskawa Institute for the Origin of Particles and the Universe, Nagoya University, 464-6801 Nagoya, Japan
40
Japanese MAGIC Group: Department of Physics, Kyoto University, 606-8502 Kyoto, Japan
41
INFN MAGIC Group: INFN Roma Tor Vergata, I-00133 Roma, Italy
42
Japanese MAGIC Group: Department of Physics, Konan University, Kobe, Hyogo, 658-8501
Japan
43
also at International Center for Relativistic Astrophysics (ICRA), Rome, Italy
44
also at Como Lake centre for AstroPhysics (CLAP), DiSAT, Università dell’Insubria, Via Valleggio 11, 22100 Como, Italy
45
also at Port d’Informació Científica (PIC), E-08193 Bellaterra, (Barcelona), Spain
46
now at Université Paris Cité, CNRS, Astroparticule et Cosmologie, F-75013 Paris, France
47
also at Dipartimento di Fisica, Università di Trieste, I-34127 Trieste, Italy
48
Max-Planck-Institut für Physik, D-85748 Garching, Germany
49
also at Università Tor Vergata, Dipartimento di Fisica, Via della Ricerca Scientifica 1, I-00133 Rome, Italy
50
also at INAF Padova, Padova, Italy
51
Japanese MAGIC Group: Institute for Cosmic Ray Research (ICRR), The University of Tokyo, Kashiwa, 277-8582 Chiba, Japan
52
ETH Zürich, CH-8093 Zürich, Switzerland
53
INAF – Astrophysical Observatory of Arcetri, Largo E. Fermi 5, 50125 Florence, Italy
54
Université Paris Cité, CNRS, Astroparticule et Cosmologie, 10 Rue Alice Domon et Léonie Duquet, 75013 Paris, France
⋆ Corresponding authors: This email address is being protected from spambots. You need JavaScript enabled to view it.
Received:
24
March
2025
Accepted:
16
July
2025
Abstract
Seyfert galaxies are emerging as a promising source class of high-energy neutrinos. The Seyfert galaxies NGC 4151 and NGC 1068 have respectively come up as the most promising counterparts of a 3σ and of a 4.2σ neutrino excesses detected by IceCube in the TeV energy range. Constraining the very high energy (VHE) emission associated with the neutrino signal is crucial to unveiling the mechanism and site of neutrino production. In this work, we present the first results of the VHE observations (∼29 hours) of NGC 4151 with the MAGIC telescopes. We detected no gamma-ray excess in the direction of NGC 4151, and we derived constraining upper limits on the VHE gamma-ray flux. The integral flux upper limit (at the 95% confidence level) above 200 GeV is f = 2.3 × 10⁻¹² cm−2 s−1. Comparison of the MAGIC and IceCube measurements suggests the presence of a gamma-ray obscured accelerator, and it allowed us to constrain the gamma-ray optical depth and the size of the neutrino production site.
Key words: neutrinos / galaxies: active / galaxies: individual: NGC 4151 / galaxies: Seyfert
© The Authors 2025
 Open Access article, published by EDP Sciences, under the terms of the Creative Commons Attribution License (https://creativecommons.org/licenses/by/4.0), which permits unrestricted use, distribution, and reproduction in any medium, provided the original work is properly cited.
This article is published in open access under the Subscribe to Open model. This email address is being protected from spambots. You need JavaScript enabled to view it. to support open access publication.
1. Introduction
After more than a decade since the IceCube discovery of an extra-terrestrial flux of high-energy neutrinos (IceCube Collaboration 2013), the nature of the astrophysical sources responsible for the production of these cosmic messengers is still unknown. The spectral properties of the diffuse neutrino flux have been characterized with increasing accuracy in the energy range from a few teraelectronvolts up to a few petaelectronvolts (Abbasi et al. 2024). Moreover, a comparison of this flux with the isotropic gamma-ray background observed by the Fermi Large Area Telescope (Fermi-LAT; Ackermann et al. 2015) disfavors optically thin gamma-ray emitters with soft spectra (spectral index ≳2.2) as the dominant neutrino source class, at least below 100 TeV (Murase et al. 2013; Aartsen et al. 2015; Bechtol et al. 2017; Peretti et al. 2020; Fang et al. 2022). These results point toward the possible existence of gamma-ray obscured cosmic ray accelerators (Murase et al. 2016). The existence of such gamma-ray obscured powerful neutrino sources was already hypothesized by pioneering works from the late seventies (Berezinsky 1977; Silberberg & Shapiro 1979; Eichler 1979; Berezinsky & Ginzburg 1981; Berezinsky et al. 1990), and the nearest neighborhoods of active galactic nuclei (AGNs) were one of the most promising environments for these conditions to be met (Stecker et al. 1991, 1992). In the vicinity of a supermassive black hole (see, e.g., Padovani et al. 2024a), the high density of gas and radiation provides the right target for protons to sustain the production of TeV neutrinos, while the AGN photon field is also strong enough to efficiently absorb gamma rays through pair-production.
In a recent IceCube analysis (IceCube Collaboration 2022), the Seyfert 2 galaxy NGC 1068 has been found to be the most significant hotspot in the northern sky, and observations in the gamma-ray band have indicated that the environment where the neutrinos are produced must be opaque to GeV-to-TeV gamma rays (Aartsen et al. 2020; Acciari et al. 2019; Ajello et al. 2023; Abbasi et al. 2025b). This finding was possible also thanks to the modest distance of the source, 10.1 Mpc (Tully et al. 2008; Padovani et al. 2024a), for which the absorption of the extragalactic background light (EBL) is not a limitation (Franceschini & Rodighiero 2017). The upper limits (ULs) on the very high energy (VHE) gamma-ray flux set by the Major Atmospheric Gamma Imaging Cherenkov (MAGIC) telescopes (Acciari et al. 2019) are more than one order of magnitude below the inferred neutrino flux. This suggests that the source is not optically thin to gamma rays. This conclusion can be reached through the common understanding of the typical hadronic interaction channels since hadronuclear (pp) and photo-hadronic (pγ) interactions produce comparable fluxes of gamma rays and neutrinos as a result of similar production rates of neutral and charged pions.
How particles can be efficiently accelerated up to hundreds of teraelectronvolts in the AGN vicinity is not yet understood. Several mechanisms such as diffusive shock acceleration (Inoue et al. 2019, 2020, 2022; Peretti et al. 2025), stochastic acceleration (Murase et al. 2020, 2024; Eichmann et al. 2022; Murase 2022; Fiorillo et al. 2024a; Lemoine & Rieger 2025), and magnetic reconnection (Kheirandish et al. 2021; Fiorillo et al. 2024b; Mbarek et al. 2024) have been proposed to explain the acceleration process. Regardless of the specific acceleration mechanism, it has been shown that if energetic protons are injected into the AGN neighborhood, they are able to produce a neutrino emission at the level of flux observed by IceCube without exceeding the gamma-ray flux. Here, gamma rays are efficiently absorbed and reprocessed via electromagnetic cascade reactions to the poorly explored MeV range (Murase et al. 2020). A key question we aim to address in this work is whether NGC 1068 is a peculiar source or representative of a broader population of gamma-ray obscured AGN neutrino sources.
Several of the acceleration models developed for the AGN nearest neighborhoods are based on equipartition arguments leading to a correlation between the neutrino luminosity and the X-ray luminosity of the AGN. Consequently, multiple studies searching for a neutrino signal in X-ray bright Seyfert galaxies have been carried out. An independent analysis of the publicly available 10-year IceCube dataset (Neronov et al. 2024), along with IceCube analyses of extended datasets using different muon track event selections (Abbasi et al. 2025b,a), have reported sizable neutrino excesses from some of the X-ray bright Seyfert galaxies in the Swift Burst Alert Telescope (Swift-BAT) catalog. These findings reinforce the idea that Seyfert galaxies can be high-energy neutrino sources that potentially dominate the diffuse neutrino flux in the TeV range (Padovani et al. 2024b; Ambrosone 2024; Fiorillo et al. 2025).
Among these, the nearby Seyfert galaxy NGC 4151 (D = 15.8 Mpc; Yuan et al. 2020) has been identified as a likely neutrino source. NGC 4151 is located at a distance of only 0.18° from the fourth most significant hotspot in the IceCube search for northern neutrino point sources (see supplement of IceCube Collaboration 2022). Neronov et al. (2024) report a ≃3σ neutrino excess at the position of NGC 4151. Abbasi et al. (2025b) also identify NGC 4151 as one of the most interesting candidates in their search for sources individually detectable by IceCube, reporting a post-trial significance of ≃2.9σ.
Although the neutrino excess from NGC 4151 is not yet statistically significant to claim a detection, it is interesting to consider the possibility that it corresponds to a real signal, and it may therefore represent a further indication of particle acceleration and hadronic interactions at work in a Seyfert galaxy. This motivates our dedicated search for VHE gamma-ray emission from this source.
NGC 4151 is classified as a Seyfert 1/1.5 (Osterbrock & Koski 1976). The inner regions of Seyfert 1 are less obscured than Seyfert 2, thus providing a direct knowledge of the intrinsic AGN photon fields. This also allows for better constraints on neutrino emission and gamma-ray absorption compared to Compton-thick Seyfert 2 galaxies such as NGC 1068. Investigating the gamma-ray–neutrino connection in NGC 4151 is also fundamental to assessing whether the neutrino production region exhibits similar gamma-ray opacity among the different Seyfert classes.
In this work, we present the first VHE observations of NGC 4151 with the MAGIC telescopes. We discuss the implications of our observations, and we derive constraints on the gamma-ray optical depth and on the size of the neutrino production site.
2. Observations and data analysis
The VHE observations were performed by the MAGIC telescopes, which consist of two 17-m diameter Imaging Atmospheric Cherenkov Telescopes located at an altitude of 2231 m above sea level on the Canary Island of La Palma, Spain, at the Roque de los Muchachos Observatory (Aleksić et al. 2016a). MAGIC has a typical energy resolution of about 16% and an angular resolution at energies of a few hundred gigaelectronvolts of less than 0.07° (Aleksić et al. 2016b). Under dark night conditions and for zenith angles < 30°, MAGIC reaches a trigger energy threshold of ∼50 GeV and a sensitivity above 220 GeV of 0.67%±0.04% of the Crab Nebula flux in 50 hours of observation (Aleksić et al. 2016b).
The telescopes, with a field of view diameter of 3.5°, observed NGC 4151 under mostly dark observational conditions and good weather from 31 March 2024 until 25 June 2024. The zenith angle (Zd) distribution of the data ranges from 10° and 50°, with the majority of the data at Zd≲ 35°. The analysis energy threshold determined by accounting for the zenith angle distribution is ∼100 GeV. In order to minimize systematics, the observations were performed in the wobble mode strategy (Fomin et al. 1994), where the camera center points at 0.4° from the NGC 4151 position so that the background and any possible gamma-ray signal can be estimated simultaneously.
After removing data affected by abnormally low background rates and data with a median aerosol transmission at 9 km measured to be below 70% that of a clear night (Fruck et al. 2022; Schmuckermaier et al. 2023), the final sample consisted of about 29 hours of effective observation time of good-quality data1 collected across 20 nights. A small fraction of the observations (3.4 hours) are affected by the presence of the moon, which increases the night sky background fluctuations. However, the night sky background level of the moon dataset is less than two times the one under dark conditions, so the moon and dark data samples were analyzed together applying the same standard image cleaning levels and Monte Carlo files.
Data were analyzed using the standard MAGIC Analysis and Reconstruction Software (MARS) package (Zanin et al. 2013; Aleksić et al. 2016b). The data processing pipeline consists of calibration, image cleaning, and calculation of the second moment of the elliptical-shaped camera images of the telescopes, the so-called Hillas parameterization. The random forest algorithm based on the reconstruction parameters was used to separate the hadronic background from the gamma-ray signal as well as to estimate the primary gamma-ray energy. To verify the validity of the reconstruction performance for NGC 4151, the same analysis pipeline was applied to Crab Nebula data for similar periods and zenith angle distributions.
3. Results
Within the 29 hours of MAGIC observation, no significant gamma-ray emission was detected. Figure 1 shows the number of detected gamma-ray candidate events as a function of the squared angular distance to the NGC 4151 position (points) for energies greater than about 100 GeV, while the shaded gray region shows the estimated background. The vertical dashed line defines the boundary of the signal region within which the detection significance was computed. We found 3815 gamma-like events for 3832.7 ± 35.7 expected background events, which yields a significance of −0.2σ (Li & Ma 1983). Given the lack of a significant signal from NGC 4151, the ULs on the photon flux emitted in the VHE band were derived. The flux ULs were calculated following Rolke et al. (2005), with a confidence level of 95%, and considering a systematic uncertainty on the gamma-ray detection efficiency of 30% (Aleksić et al. 2016b).
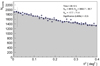 |
Fig. 1. Squared angular distance (θ2) to the NGC 4151 position distribution showing the number of gamma-ray candidate events as a function of the squared angular separation between the reconstructed gamma-ray direction and the NGC 4151 position. The distribution of θ2, defined relative to the position of NGC 4151, is indicated with the black points, while the gray histogram corresponds to the θ2 distribution defined relative to one of the background estimation points (Fomin et al. 1994). The vertical dashed line defines the signal region within which the detection significance is computed. |
The integral flux UL (at the 95% confidence level) above 200 GeV is f = 2.3 × 10⁻¹² cm−2 s−1, assuming a power-law gamma-ray spectrum ϕ = ϕ0(E/E0)−Γ, with spectral index Γ = 2.83. The differential ULs up to ∼10 TeV are shown in Fig. 2 and listed in Table 1. Since our goal is to constrain the gamma-ray emission associated with the neutrino emission, the spectral index was assumed to be equal to the spectral index of the best-fit neutrino spectrum obtained from 12 years of IceCube (muon track) data (Abbasi et al. 2025b), which is reported in the same figure (orange line) together with the 68% statistical uncertainty.
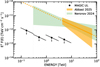 |
Fig. 2. Multi-messenger SED of NGC 4151 in the VHE band. Black points indicate the MAGIC ULs derived in this work assuming a power-law spectral index Γ = 2.83. The orange solid line and band refer to the best-fit and 1σ contour of the single-flavor neutrino spectrum derived from IceCube data collected from muon tracks over 12 years (Abbasi et al. 2025b), while the dotted orange line corresponds to its extrapolation in energy. The green band refers to the single-flavor neutrino spectrum derived from the publicly available 10-year IceCube dataset (adapted from Neronov et al. 2024). |
Spectral energy distribution in the VHE band.
In Figure 2 we also show the neutrino spectrum derived by Neronov et al. (2024) using the publicly available 10 years of IceCube data (shaded green region). Although Abbasi et al. (2025b) determines that the central 68% of the contribution to the test statistic for NGC 4151 comes from neutrinos with energies between 4.3 TeV and 65.2 TeV, we used the neutrino spectrum derived by Neronov et al. (2024) to assess the impact of the energy range and flux normalization on our results.
We also computed the ULs assuming a standard power-law spectral index of Γ = 2.0, with the aim of allowing a direct comparison with similar sources already published in the literature (e.g., NGC 1068; Acciari et al. 2019). These ULs, given in Table 1 and shown in Fig. 3, differ from those derived for Γ = 2.83 by at most ∼10%, indicating that they do not strongly depend on the assumed spectral index. Figure 3 extends the multi-messenger spectral energy distribution (SED) into the GeV band by including the spectral points detected by Fermi-LAT from the direction of NGC 4151. In the Fermi-LAT band, the region of NGC 4151 was first investigated in a study aimed at detecting the cumulative emission from AGNs hosting ultra fast outflows (Ajello et al. 2021). In that work, an individual significance of 4.2σ was found from the position of NGC 4151. More recent studies (Abdollahi et al. 2022; Ballet et al. 2023; Murase et al. 2024; Peretti et al. 2025) have unveiled two point-like gamma-ray sources within 1° from the galaxy. One, 4FGL J1211.6+3901, is associated with the z ≃ 0.6 blazar FIRST J121134.2+390053 and is located at 0.4° from the center of NGC 4151. The other source, 4FGL J1210.3+3928, is associated with the high synchrotron peak blazar 1E 1207.9+3945, also located around z = 0.61, and is found only 4.7 arcmin away from the center of NGC 4151. The presence of the latter background blazar makes the disentanglement among the potential emitters very challenging at the Fermi-LAT energies (see, e.g., Murase et al. 2024; Peretti et al. 2025). The blue data points in Figure 3 indicate the gamma-ray spectrum of 4FGL J1210.3+3928 from the 4FGL-DR3 source catalog (Abdollahi et al. 2022). We note that the ULs derived in the VHE band are in agreement with the Fermi-LAT data above ∼100 GeV and that a possible contamination of the gamma-ray emission from the background blazars could only affect the MAGIC observations at energies below ∼200 GeV since the EBL absorption coefficient is ≳1 at higher energies for a source emitting at a redshift of 0.6. Since we do not detect the emission but only derive ULs on the gamma-ray flux, any contamination from the background blazar would make these limits even more conservative.
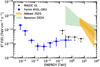 |
Fig. 3. Multi-messenger SED of NGC 4151 in the HE and VHE bands. Black points indicate the MAGIC ULs obtained in this work assuming a power-law spectral index Γ = 2.0. Blue data points indicate the Fermi-LAT spectrum of 4FGL J1210.3+3928 (spatially coincident with NGC 4151) from Abdollahi et al. (2022). Neutrino spectra are the same as in Fig. 2. |
4. Phenomenological constraints on the size of the neutrino source
The non-detection of NGC 4151 in the VHE gamma-ray domain can aid in constraining some key properties of the neutrino source observed by IceCube in association with NGC 4151. For instance, the size of the emitting region can be probed through a model-independent study of its optical depth. Since NGC 4151, as with NGC 1068, is expected to be a steady-state source of high-energy neutrinos (Abbasi et al. 2021; Dave et al. 2024), we worked under the assumption of steady production of neutrinos and gamma rays during the observational time of IceCube and MAGIC. The spectra of neutrinos and gamma rays resulting from pp interactions depend on the spectrum of primary protons, while in pγ interactions, they are also determined by the spectrum of target photons. Neutrino production in a photon-rich environment also causes gamma-ray attenuation due to the onset of pair production in the ambient radiation field. The absorbed gamma-ray power is expected to be reprocessed at lower energies via the electromagnetic cascade. Thus, if the source is optically thick, the gamma-ray spectrum may undergo significant modifications before leaving the source, making the relation between observed gamma-ray and neutrino spectra more complex. However, the production spectra of gamma rays and neutrinos are expected to be similar, as almost identical production rates of charged and neutral pions sharing the same energy are typical of hadronic and photo-hadronic interactions (Kelner et al. 2006; Kelner & Aharonian 2008; Roulet & Vissani 2021; Condorelli & Petrera 2025). Therefore, we assumed that gamma rays are produced with the same power-law inferred for the neutrinos in the energy range observed by IceCube. Given K as the average ratio of the number of charged to neutral pions, the energy production rate of gamma rays and neutrinos produced in hadronic (K = 2), or photo-hadronic (K = 1) interactions, are related as follows (Murase et al. 2016):
 (1)
(1)
where, Qγ (Qν) is the production rate of gamma rays (all-flavor neutrinos) at energy Eγ (Eν ≈ Eγ/2). This enables an estimation of the intrinsic gamma-ray emissivity when given the neutrino one. Equation (1) depends on the interaction scenario and the slope of the particle distribution. To remain conservative, we adopted the most pessimistic assumption, which minimizes the gamma-to-neutrino production ratio, namely, K = 2 and a spectral slope Γ = 2. This choice ensured that our subsequent estimates are conservative, and it corresponds to a gamma-ray flux approximately equal to twice the single-flavor neutrino flux at the same energy.
As the gamma-gamma absorption can play a dominant role in the AGN vicinity, it is fundamental to properly account for the AGN photon field. To this end, we adopted the analytic prescriptions described in Marconi et al. (2004) and Mullaney et al. (2011) respectively for the optical to X-ray intrinsic AGN spectrum and the associated infrared component, and we assumed an X-ray luminosity of LX = 8 × 1042 erg s−1 (Yang et al. 2001; Gianolli et al. 2023). The volume density of the higher energy background photons and gamma rays is set by assuming a specific value, R, for the source radius. The low energy photon background and the associated optical depth were computed as reported in Appendix A.
In our multi-messenger analysis, we computed the observationally motivated intrinsic gamma-ray luminosity as follows. We assumed as a reference, the power-law neutrino spectrum provided by the IceCube collaboration in Abbasi et al. (2025b), with the best-fit normalization at 1 TeV  TeV−1 cm−2 s−1 and the spectral slope
  . We assumed the best-fit value as a benchmark, and we also considered the whole 1σ uncertainty for both parameters,
  and Γ. Since the low neutrino statistics prevent a precise determination of the IceCube spectrum, we extended the parameter exploration to include the case Γ = 2 and examined how lower values of the spectral normalization affect our results. Finally, we obtained the gamma-ray spectra following Eq. (1). The resulting gamma-ray luminosity (computed for the energy range E ≥ 300 GeV), Lγ, ranges from 1042 to 1043 erg s−1, which is ≲5% of the bolometric luminosity (Lbol ≈ 1.9 × 1044 erg s−1).
Figure 4 illustrates the dependence of the gamma-ray spectrum on the assumed source size, R, keeping constant only the impact of gamma-gamma absorption on the EBL. As discussed in Appendix A, the gamma-ray optical depth scales as τγγ ∼ R−1; thus, the more compact the source, the greater the gamma-ray optical depth. We initially limited our analysis to the energy range probed by Abbasi et al. (2025b), and then we expanded it to include the wider energy range considered in Neronov et al. (2024). The comparison of the gamma-ray emission computed without internal absorption (gray line and band) with the MAGIC UL at 5 TeV clearly implies a substantial level of absorption inside the source. Figure 4 also reveals that the gamma-ray flux is not compatible with the MAGIC UL for an emission size R ≳ 2 × 10⁴ Rg (light blue band), where Rg = GMBH/c2 is the gravitational radius. For a black hole mass of MBH = 4.57 × 10⁷ M⊙ (Bentz et al. 2006; Gianolli et al. 2023), this emission size corresponds to approximately 4 × 10⁻² pc. The largest radius allowing the gamma-ray spectral band to be completely localized below the MAGIC UL was found at R ≃ 3 × 10² Rg, which corresponds to 6 × 10⁻⁴ pc.
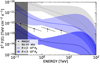 |
Fig. 4. Phenomenological constraints on the size of the neutrino source obtained by comparing the different predictions with MAGIC ULs (black points). The gray dotted curve represents the unabsorbed gamma-ray flux corresponding to the best-fit neutrino spectrum, considering only the EBL absorption, while the gray band accounts for the uncertainty in both |

Since we are also considering the analysis performed in Neronov et al. (2024), we extrapolated the reference neutrino spectrum of Abbasi et al. (2025b) and its 1σ uncertainty to 300 GeV. This allowed for a multi-messenger analysis over an extended energy range probed by MAGIC observations. As shown in Figure 4, the derived constraints on the size of the neutrino production region remain valid. We note, however, that while the 1σ uncertainty band of Abbasi et al. (2025b) is in agreement with the flux uncertainty of Neronov et al. (2024) for energies between 4 and 10 TeV, its extrapolation to lower energies does not match the lower bound of the neutrino flux found in their analysis (see Fig. 2). We verified that when assuming this lower bound for the neutrino flux, our constraints on the neutrino production region are robust within a factor of approximately two. We did not consider extrapolations of the gamma-ray spectra to energies lower than 300 GeV, as they are not supported by the presence of neutrino data. In addition, we note that extrapolations to lower energies would also result in a gamma-ray luminosity comparable to or exceeding the AGN bolometric luminosity. Furthermore, such extrapolations would be better constrained by the emission of the Fermi-LAT source 4FGL J1210.3+3928, which is spatially coincident with NGC 4151.
5. Discussion
Similar to NGC 1068, NGC 4151 appears as a bright TeV neutrino source candidate opaque in gamma rays at the same energy. Therefore, the nearest neighborhood, R ≲ 104 Rg, of the accreting supermassive black hole (often referred to as the corona or cocoon, as discussed in pioneering works by Berezinsky 1977; Berezinsky & Ginzburg 1981; Berezinsky et al. 1990; Silberberg & Shapiro 1979; Eichler 1979; Stecker et al. 1991) emerges as the most plausible candidate production site of such astronomical messengers (Padovani et al. 2024a).
The phenomenological test performed in the previous section is intended to illustrate the constraining power of MAGIC ULs to the size of the neutrino source. MAGIC observations are crucial for advancing our understanding of candidate neutrino sources such as Seyfert galaxies since MAGIC operates in the VHE band, which partially overlaps with the operational energy range of the IceCube neutrino observatory. A model-independent constraint on the source’s opacity can only be obtained if a gamma-ray counterpart is not detected in the same energy range as that of the observed neutrinos. The constraining power of other wavelengths remains model-dependent, as the production spectra of gamma rays and neutrinos can be very hard.
Therefore, focusing the analysis in the energy range above 4 TeV (or 300 GeV when also Neronov et al. 2024, is considered) is not a limitation, as we did not intend to perform detailed physical modeling. We only point out that a simple extrapolation of the gamma-ray flux down to the GeV range would lead to a total gamma-ray luminosity exceeding the bolometric one. However, we also observed that a spectral break somewhere around TeV (or 102 GeV) and a hard low-energy spectral slope (∼E−1) can be expected according to several physical models studying the nearest neighborhoods of AGN (Padovani et al. 2024a).
In this context, the fiducial gamma-ray flux, if preceded by a hardening below some energy break, might mimic the spectral behavior of models of cosmic-ray acceleration in the AGN corona through magnetic reconnection (Kheirandish et al. 2021; Fiorillo et al. 2024b) or turbulence (Murase et al. 2020; Eichmann et al. 2022; Murase 2022; Fiorillo et al. 2024a; Mbarek et al. 2024; Lemoine & Rieger 2025). Scenarios of diffusive shock acceleration at accretion shocks or at shocks developed in the early stages of a fast AGN-driven wind (Inoue et al. 2019, 2020, 2022; Peretti et al. 2025) are unlikely to produce spectra harder than E−2, consequently their activity can be much better constrained by the Fermi-LAT observation in the GeV domain.
NGC 4151 is one of the brightest X-ray sources in the local Universe, and its possible association with neutrino emission aligns with predictions from acceleration models developed for the AGN nearest neighborhoods, which foresee a correlation between the X-ray and neutrino emission. However, this expectation is challenged by the fact that Abbasi et al. (2025b) reports no significant neutrino signal in the IceCube stacked analysis of the X-ray bright Swift-BAT sources. Nevertheless, uncertainties in intrinsic X-ray luminosity estimates, particularly for Compton-thick AGN, may introduce biases in the analysis, as strong absorption of the primary AGN emission and Compton reflection can significantly affect the determination of the X-ray luminosity. On the other hand, gamma rays associated with neutrino emission, as outlined in the scenario presented here, are expected to be largely absorbed at energies above a few gigaelectronvolts (see Fig. A.2). Future VHE observations, such as with the Cherenkov Telescope Array Observatory, will extend the spectral coverage and improve sensitivity, thereby providing valuable constraints on the transport property of the emission region, its gamma-ray optical depth, and the maximum energy of accelerated particles in these sources.
6. Conclusions
Recently, NGC 4151 has been in the spotlight as one of the brightest hotspots of the IceCube neutrino sky. Analyses using IceCube data identified NGC 4151 as a potential counterpart to a ∼3σ neutrino excess in the TeV energy range.
The observation of the Seyfert galaxy NGC 4151 with the MAGIC telescopes resulted in a non-detection. The data were accumulated from March to June 2024 for about 29 hours in good observational conditions. This allowed us to set constraining ULs on the gamma-ray flux from this object in the energy range between 100 GeV and 10 TeV.
Gamma-ray and neutrino detectors operating in the same energy band are instrumental to obtaining model-independent constraints on the opacity of the neutrino production site. Since the neutrino spectrum in NGC 4151 spans the energy range ∼4−60 TeV (Abbasi et al. 2025b), the VHE band is the optimal observational window to study absorption effects in this source. The neutrino flux is observed at the level of 10−12 − 10−11 TeV cm−2 s−1 in the energy range where MAGIC and IceCube overlap. If this neutrino flux were to be confirmed, it would be incompatible with the ULs set by MAGIC in the context of NGC 4151 as an optically thin gamma-ray source.
The Seyfert 1/1.5 nature of NGC 4151 allowed us to have direct knowledge of the intrinsic X-ray luminosity of the AGN and consequently of the photon field of the AGN. This allowed us to employ a phenomenological test and set an upper limit on the size of the neutrino production region below 104 gravitational radii. Such a result remains valid under different assumptions on the spectral shape of the injected particles.
This work shows that NGC 4151 is the second Seyfert galaxy, after NGC 1068, that might host a high-energy neutrino source optically thick to gamma rays. This suggests that, regardless of the Seyfert 1/2 classification, the neutrino production site in this class of sources has similar characteristics in terms of gamma-ray opacity.
To assess the validity of this interpretation, confirmation of the neutrino signal from this source and a more precise measurement of its spectrum are required. This will be achieved through the accumulation of additional data from current and next-generation neutrino detectors and more sensitive analyses with updated techniques.
Data availability
Table 1 is available at the CDS via https://cdsarc.cds.unistra.fr/viz-bin/cat/J/A+A/702/A38
We note that 93% of the data have an aerosol transmission greater than 85% of that of a clear night.
Acknowledgments
We would like to thank the Instituto de Astrofísica de Canarias for the excellent working conditions at the Observatorio del Roque de los Muchachos in La Palma. The financial support of the German BMBF, MPG and HGF; the Italian INFN and INAF; the Swiss National Fund SNF; the grants PID2019-104114RB-C31, PID2019-104114RB-C32, PID2019-104114RB-C33, PID2019-105510GB-C31, PID2019-107847RB-C41, PID2019-107847RB-C42, PID2019-107847RB-C44, PID2019-107988GB-C22, PID2022-136828NB-C41, PID2022-137810NB-C22, PID2022-138172NB-C41, PID2022-138172NB-C42, PID2022-138172NB-C43, PID2022-139117NB-C41, PID2022-139117NB-C42, PID2022-139117NB-C43, PID2022-139117NB-C44 funded by the Spanish MCIN/AEI/ 10.13039/501100011033 and “ERDF A way of making Europe”; the Indian Department of Atomic Energy; the Japanese ICRR, the University of Tokyo, JSPS, and MEXT; the Bulgarian Ministry of Education and Science, National RI Roadmap Project DO1-400/18.12.2020 and the Academy of Finland grant nr. 320045 is gratefully acknowledged. This work was also been supported by Centros de Excelencia “Severo Ochoa” y Unidades “María de Maeztu” program of the Spanish MCIN/AEI/ 10.13039/501100011033 (CEX2019-000920-S, CEX2019-000918-M, CEX2021-001131-S) and by the CERCA institution and grants 2021SGR00426 and 2021SGR00773 of the Generalitat de Catalunya; by the Croatian Science Foundation (HrZZ) Project IP-2022-10-4595 and the University of Rijeka Project uniri-prirod-18-48; by the Deutsche Forschungsgemeinschaft (SFB1491) and by the Lamarr-Institute for Machine Learning and Artificial Intelligence; by the Polish Ministry Of Education and Science grant No. 2021/WK/08; by the Brazilian MCTIC, the CNPq Productivity Grant 309053/2022-6 and FAPERJ Grants E-26/200.532/2023 and E-26/211.342/2021. E.P. was supported by Agence Nationale de la Recherche (grant ANR-21-CE31-0028) and by INAF through “Assegni di ricerca per progetti di ricerca relativi a CTA e precursori”. Author Contributions. A. Lamastra: project management, P.I. of MAGIC observations, MAGIC data analysis, theoretical interpretation, paper drafting; S. Mangano: MAGIC analysis cross-check, paper drafting; S. Menon: MAGIC data analysis, paper drafting; E. Peretti: P.I. theory, theoretical modeling and interpretation, paper drafting; G. Peron: Fermi-LAT data interpretation and paper drafting; F. G. Saturni: theoretical interpretation and paper drafting. The rest of the authors have contributed in one or several of the following ways: design, construction, maintenance and operation of the instrument(s) used to acquire the data; preparation and/or evaluation of the observation proposals; data acquisition, processing, calibration and/or reduction; production of analysis tools and/or related Monte Carlo simulations; overall discussions about the contents of the draft, as well as related refinements in the descriptions.
References
- Aartsen, M. G., Abraham, K., Ackermann, M., et al. 2015, ApJ, 809, 98 [NASA ADS] [CrossRef] [Google Scholar]
- Aartsen, M. G., Ackermann, M., Adams, J., et al. 2020, Phys. Rev. Lett., 124, 051103 [Google Scholar]
- Abbasi, R., Ackermann, M., Adams, J., et al. 2021, ApJ, 920, L45 [NASA ADS] [CrossRef] [Google Scholar]
- Abbasi, R., Ackermann, M., Adams, J., et al. 2024, Phys. Rev. D, 110, 022001 [CrossRef] [Google Scholar]
- Abbasi, R., Ackermann, M., Adams, J., et al. 2025a, ApJ, 988, 141 [Google Scholar]
- Abbasi, R., Ackermann, M., Adams, J., et al. 2025b, ApJ, 981, 131 [Google Scholar]
- Abdollahi, S., Acero, F., Baldini, L., et al. 2022, ApJS, 260, 53 [NASA ADS] [CrossRef] [Google Scholar]
- Acciari, V. A., Ansoldi, S., Antonelli, L. A., et al. 2019, ApJ, 883, 135 [NASA ADS] [CrossRef] [Google Scholar]
- Ackermann, M., Ajello, M., Albert, A., et al. 2015, ApJ, 799, 86 [Google Scholar]
- Aharonian, F. A. 2004, Very High Energy Cosmic Gamma Radiation: A Crucial Window on the Extreme Universe (World Scientific Publishing) [Google Scholar]
- Aharonian, F., Khangulyan, D., & Costamante, L. 2008, MNRAS, 387, 1206 [NASA ADS] [CrossRef] [Google Scholar]
- Ajello, M., Baldini, L., Ballet, J., et al. 2021, ApJ, 921, 144 [CrossRef] [Google Scholar]
- Ajello, M., Murase, K., & McDaniel, A. 2023, ApJ, 954, L49 [NASA ADS] [CrossRef] [Google Scholar]
- Aleksić, J., Ansoldi, S., Antonelli, L., et al. 2016a, Astropart. Phys., 72, 61 [NASA ADS] [CrossRef] [Google Scholar]
- Aleksić, J., Ansoldi, S., Antonelli, L. A., et al. 2016b, Astropart. Phys., 72, 76 [Google Scholar]
- Ambrosone, A. 2024, JCAP, 2024, 075 [Google Scholar]
- Ballet, J., Bruel, P., Burnett, T. H., et al. 2023, ArXiv e-prints [arXiv:2307.12546] [Google Scholar]
- Bechtol, K., Ahlers, M., Di Mauro, M., Ajello, M., & Vandenbroucke, J. 2017, ApJ, 836, 47 [Google Scholar]
- Bentz, M. C., Denney, K. D., Cackett, E. M., et al. 2006, ApJ, 651, 775 [NASA ADS] [CrossRef] [Google Scholar]
- Berezinsky, V. S. 1977, Proceedings of the International Conference Neutrino ’77, 177 [Google Scholar]
- Berezinsky, V. S., & Ginzburg, V. L. 1981, Int. Cosmic Ray Conf., 1, 238 [Google Scholar]
- Berezinsky, V. S., Bulanov, S. V., Dogiel, V. A., & Ptuskin, V. S. 1990, Astrophysics of Cosmic Rays (Amsterdam: North-Holland) [Google Scholar]
- Condorelli, A., & Petrera, S. 2025, Astropart. Phys., 165, 103047 [Google Scholar]
- Dave, P., Taboada, I., & IceCube Collaboration 2024, 38th International Cosmic Ray Conference, 973 [Google Scholar]
- Eichler, D. 1979, ApJ, 232, 106 [Google Scholar]
- Eichmann, B., Oikonomou, F., Salvatore, S., Dettmar, R.-J., & Tjus, J. B. 2022, ApJ, 939, 43 [NASA ADS] [CrossRef] [Google Scholar]
- Fang, K., Gallagher, J. S., & Halzen, F. 2022, ApJ, 933, 190 [NASA ADS] [CrossRef] [Google Scholar]
- Fiorillo, D. F. G., Comisso, L., Peretti, E., Petropoulou, M., & Sironi, L. 2024a, ApJ, 974, 75 [NASA ADS] [CrossRef] [Google Scholar]
- Fiorillo, D. F. G., Petropoulou, M., Comisso, L., Peretti, E., & Sironi, L. 2024b, ApJ, 961, L14 [NASA ADS] [CrossRef] [Google Scholar]
- Fiorillo, D. F. G., Comisso, L., Peretti, E., Petropoulou, M., & Sironi, L. 2025, ArXiv e-prints [arXiv:2504.06336] [Google Scholar]
- Fomin, V. P., Stepanian, A. A., Lamb, R. C., et al. 1994, Astropart. Phys., 2, 137 [Google Scholar]
- Franceschini, A., & Rodighiero, G. 2017, A&A, 603, A34 [NASA ADS] [CrossRef] [EDP Sciences] [Google Scholar]
- Fruck, C., Gaug, M., Hahn, A., et al. 2022, MNRAS, 515, 4520 [NASA ADS] [CrossRef] [Google Scholar]
- Gianolli, V. E., Kim, D. E., Bianchi, S., et al. 2023, MNRAS, 523, 4468 [NASA ADS] [CrossRef] [Google Scholar]
- IceCube Collaboration 2013, Science, 342, 1242856 [Google Scholar]
- IceCube Collaboration (Abbasi, R., et al.) 2022, Science, 378, 538 [CrossRef] [PubMed] [Google Scholar]
- Inoue, Y., Khangulyan, D., Inoue, S., & Doi, A. 2019, ApJ, 880, 40 [Google Scholar]
- Inoue, Y., Khangulyan, D., & Doi, A. 2020, ApJ, 891, L33 [Google Scholar]
- Inoue, S., Cerruti, M., Murase, K., & Liu, R. Y. 2022, ArXiv e-prints [arXiv:2207.02097] [Google Scholar]
- Kelner, S. R., & Aharonian, F. A. 2008, Phys. Rev. D, 78, 034013 [Google Scholar]
- Kelner, S. R., Aharonian, F. A., & Bugayov, V. V. 2006, Phys. Rev. D, 74, 034018 [Google Scholar]
- Kheirandish, A., Murase, K., & Kimura, S. S. 2021, ApJ, 922, 45 [NASA ADS] [CrossRef] [Google Scholar]
- Lafferty, G. D., & Wyatt, T. R. 1995, Nucl. Instrum. Meth. Phys. Res. A, 355, 541 [Google Scholar]
- Lemoine, M., & Rieger, F. 2025, A&A, 697, A124 [NASA ADS] [CrossRef] [EDP Sciences] [Google Scholar]
- Li, T. P., & Ma, Y. Q. 1983, ApJ, 272, 317 [CrossRef] [Google Scholar]
- Lyu, J., & Rieke, G. H. 2021, ApJ, 912, 126 [NASA ADS] [CrossRef] [Google Scholar]
- Marconi, A., Risaliti, G., Gilli, R., et al. 2004, MNRAS, 351, 169 [Google Scholar]
- Mbarek, R., Philippov, A., Chernoglazov, A., Levinson, A., & Mushotzky, R. 2024, Phys. Rev. D, 109, L101306 [CrossRef] [Google Scholar]
- Mullaney, J. R., Alexander, D. M., Goulding, A. D., & Hickox, R. C. 2011, MNRAS, 414, 1082 [Google Scholar]
- Murase, K. 2022, ApJ, 941, L17 [NASA ADS] [CrossRef] [Google Scholar]
- Murase, K., Ahlers, M., & Lacki, B. C. 2013, Phys. Rev. D, 88, 121301 [Google Scholar]
- Murase, K., Guetta, D., & Ahlers, M. 2016, Phys. Rev. Lett., 116, 071101 [NASA ADS] [CrossRef] [Google Scholar]
- Murase, K., Kimura, S. S., & Mészáros, P. 2020, Phys. Rev. Lett., 125, 011101 [Google Scholar]
- Murase, K., Karwin, C. M., Kimura, S. S., Ajello, M., & Buson, S. 2024, ApJ, 961, L34 [NASA ADS] [CrossRef] [Google Scholar]
- Neronov, A., Savchenko, D., & Semikoz, D. V. 2024, Phys. Rev. Lett., 132, 101002 [NASA ADS] [CrossRef] [Google Scholar]
- Osterbrock, D. E., & Koski, A. T. 1976, MNRAS, 176, 61P [NASA ADS] [CrossRef] [Google Scholar]
- Padovani, P., Resconi, E., Ajello, M., et al. 2024a, Nat. Astron., 8, 1077 [Google Scholar]
- Padovani, P., Gilli, R., Resconi, E., Bellenghi, C., & Henningsen, F. 2024b, A&A, 684, L21 [NASA ADS] [CrossRef] [EDP Sciences] [Google Scholar]
- Peretti, E., Blasi, P., Aharonian, F., Morlino, G., & Cristofari, P. 2020, MNRAS, 493, 5880 [NASA ADS] [CrossRef] [Google Scholar]
- Peretti, E., Lamastra, A., Saturni, F. G., et al. 2023, MNRAS, 526, 181 [Google Scholar]
- Peretti, E., Peron, G., Tombesi, F., et al. 2025, JCAP, 2025, 013 [Google Scholar]
- Rolke, W. A., López, A. M., & Conrad, J. 2005, Nucl. Instrum. Meth. Phys. Res. A, 551, 493 [Google Scholar]
- Roulet, E., & Vissani, F. 2021, JCAP, 2021, 050 [Google Scholar]
- Schmuckermaier, F., Gaug, M., Fruck, C., et al. 2023, A&A, 673, A2 [Google Scholar]
- Silberberg, R., & Shapiro, M. M. 1979, Int. Cosmic Ray Conf., 10, 357 [NASA ADS] [Google Scholar]
- Stecker, F. W., Done, C., Salamon, M. H., & Sommers, P. 1991, Phys. Rev. Lett., 66, 2697 [Google Scholar]
- Stecker, F. W., Done, C., Salamon, M. H., & Sommers, P. 1992, Phys. Rev. Lett., 69, 2738 [Google Scholar]
- Tully, R. B., Shaya, E. J., Karachentsev, I. D., et al. 2008, ApJ, 676, 184 [Google Scholar]
- Yang, Y., Wilson, A. S., & Ferruit, P. 2001, ApJ, 563, 124 [NASA ADS] [CrossRef] [Google Scholar]
- Yuan, W., Fausnaugh, M. M., Hoffmann, S. L., et al. 2020, ApJ, 902, 26 [NASA ADS] [CrossRef] [Google Scholar]
- Zanin, R., Carmona, E., Sitarek, J., et al. 2013, Int. Cosmic Ray Conf., 33, 2937 [NASA ADS] [Google Scholar]
Appendix A: Background photon field and opacity
The AGN SED is constructed following the analytical prescription of Marconi et al. (2004) (see also Peretti et al. 2023). Such parametrization is characterized by a thermal component produced by the accretion disk and an X-ray power law due to the corona. These two components are connected by an empirical scaling, known as αOX, which depends on the overall intrinsic AGN luminosity. Even though it plays a subdominant role in terms of photon density for the spatial regions considered in our analysis, for the sake of completeness we also include the parametrization of the infrared peak (Mullaney et al. 2011) produced by the dusty torus surrounding the AGN. While, with good approximation, the X-ray and optical big blue bump originate from the innermost AGN region (corona and accretion disk), the infrared emission is spread over a much larger volume given the parsec-scale size of the dusty torus. In agreement with Lyu & Rieke (2021), we assumed 1 pc as a characteristic size for the torus.
Fig. A.1 represents the assumed AGN intrinsic SED. The curve is normalized to an X-ray luminosity of LX = 8 × 1042 erg s−1 (Yang et al. 2001; Gianolli et al. 2023). This corresponds to the following bolometric luminosity Lbol ≈ 1.9 × 1044 erg s−1.
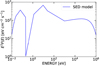 |
Fig. A.1. Spectral energy distribution of an AGN with an X-ray luminosity LX = 8 × 1042 erg s−1. |
The optical depth for gamma-gamma absorption is computed following Aharonian et al. (2008):
 (A.1)
(A.1)
where nph is the background photon density evaluated at energy ϵ, ϵmin = me2c4/Eγ is the energy threshold for the pair-production with a gamma-ray of energy Eγ. We assume that X-ray and optical-UV photon fields are homogeneous in our region of interest of size R. Consequently, excluding the infrared domain, where the torus emission dominates, the photon density scales with the size as nph ∼ R−2. For this reason, the effective optical depth scales as τγγ ∼ R−1. The pair-production cross section reads as (Aharonian 2004)
![Mathematical equation: $$ \begin{aligned} \sigma _{\gamma \gamma } (E_{\gamma },\epsilon )&= \frac{3\sigma _T}{2 s^2} \Big [\Big (s+\frac{1}{2} \ln {(s)}- \frac{1}{6} +\frac{1}{2s}\Big )\,{\mathrm{ln} (\sqrt{s} + \sqrt{s-1})}\nonumber \\&- \Big (s + \frac{4}{9} - \frac{1}{9s}\Big )\Big (\sqrt{1-\frac{1}{s}}\Big )\Big ], \end{aligned} $$](/articles/aa/full_html/2025/10/aa54723-25/aa54723-25-eq7.gif) (A.2)
(A.2)
where s = ϵEγ/(me2c4) and σT is the Thompson cross section.
Figure A.2 illustrates the behavior of the optical depth as a function of the energy under different assumptions for the size of the emitting region. In particular, we show the optical depth corresponding to the gravitational radii assumed in calculating the absorbed gamma-ray emission described in Section 4.
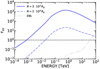 |
Fig. A.2. Optical depth for γγ absorption of gamma-ray photons from the source assuming different sizes for the various emitting regions R (blue lines). The optical depth due to interaction with EBL photons (Franceschini & Rodighiero 2017) is shown by the gray line. |
All Tables
All Figures
|
Fig. 1. Squared angular distance (θ2) to the NGC 4151 position distribution showing the number of gamma-ray candidate events as a function of the squared angular separation between the reconstructed gamma-ray direction and the NGC 4151 position. The distribution of θ2, defined relative to the position of NGC 4151, is indicated with the black points, while the gray histogram corresponds to the θ2 distribution defined relative to one of the background estimation points (Fomin et al. 1994). The vertical dashed line defines the signal region within which the detection significance is computed. |
| In the text | |
|
Fig. 2. Multi-messenger SED of NGC 4151 in the VHE band. Black points indicate the MAGIC ULs derived in this work assuming a power-law spectral index Γ = 2.83. The orange solid line and band refer to the best-fit and 1σ contour of the single-flavor neutrino spectrum derived from IceCube data collected from muon tracks over 12 years (Abbasi et al. 2025b), while the dotted orange line corresponds to its extrapolation in energy. The green band refers to the single-flavor neutrino spectrum derived from the publicly available 10-year IceCube dataset (adapted from Neronov et al. 2024). |
| In the text | |
|
Fig. 3. Multi-messenger SED of NGC 4151 in the HE and VHE bands. Black points indicate the MAGIC ULs obtained in this work assuming a power-law spectral index Γ = 2.0. Blue data points indicate the Fermi-LAT spectrum of 4FGL J1210.3+3928 (spatially coincident with NGC 4151) from Abdollahi et al. (2022). Neutrino spectra are the same as in Fig. 2. |
| In the text | |
|
Fig. 4. Phenomenological constraints on the size of the neutrino source obtained by comparing the different predictions with MAGIC ULs (black points). The gray dotted curve represents the unabsorbed gamma-ray flux corresponding to the best-fit neutrino spectrum, considering only the EBL absorption, while the gray band accounts for the uncertainty in both |
| In the text | |
|
Fig. A.1. Spectral energy distribution of an AGN with an X-ray luminosity LX = 8 × 1042 erg s−1. |
| In the text | |
|
Fig. A.2. Optical depth for γγ absorption of gamma-ray photons from the source assuming different sizes for the various emitting regions R (blue lines). The optical depth due to interaction with EBL photons (Franceschini & Rodighiero 2017) is shown by the gray line. |
| In the text | |
Current usage metrics show cumulative count of Article Views (full-text article views including HTML views, PDF and ePub downloads, according to the available data) and Abstracts Views on Vision4Press platform.
Data correspond to usage on the plateform after 2015. The current usage metrics is available 48-96 hours after online publication and is updated daily on week days.
Initial download of the metrics may take a while.