Open Access
Fig. 1.
Download original image
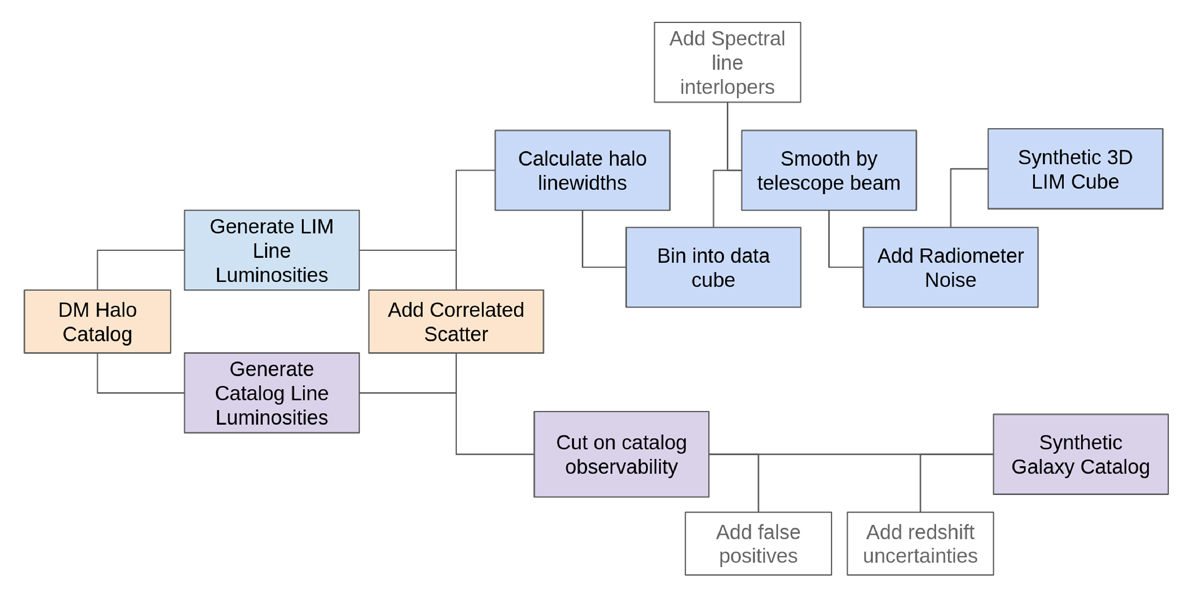
Flowchart depicting the multi-tracer simulation pipeline. Orange boxes indicate steps that affect both the galaxy catalogue and LIM data, blue boxes are actions on the simulated LIM data, and purple boxes are actions on the simulated galaxy catalogue. Steps with white boxes are optional.
Current usage metrics show cumulative count of Article Views (full-text article views including HTML views, PDF and ePub downloads, according to the available data) and Abstracts Views on Vision4Press platform.
Data correspond to usage on the plateform after 2015. The current usage metrics is available 48-96 hours after online publication and is updated daily on week days.
Initial download of the metrics may take a while.