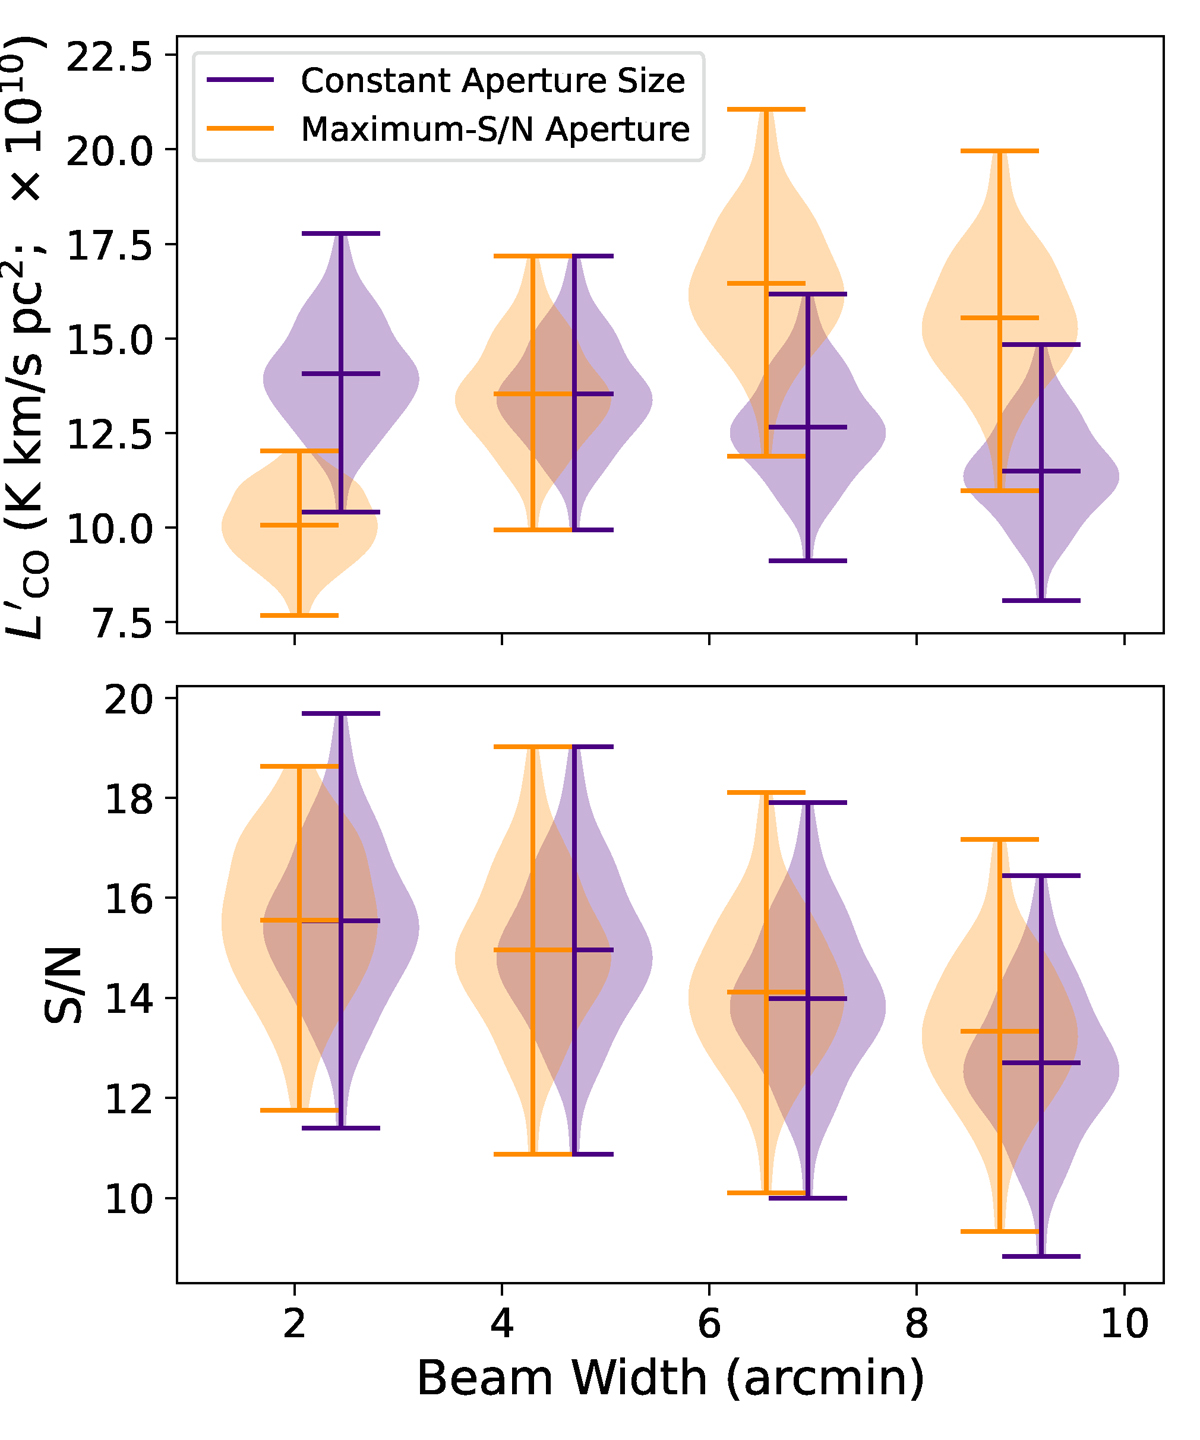
Fig. 14.
Download original image
Violin plot showing the distribution of S/N ratios output from simulated stacks as a function of the beam FWHM (i.e. angular resolution) of the LIM experiment while holding the pixelisation constant. We show a version where we hold the size of the spatial aperture constant as well as a version where we set the spatial aperture to the size that maximizes the S/N ratio of the stack. Violins are offset slightly in the x-axis for legibility.
Current usage metrics show cumulative count of Article Views (full-text article views including HTML views, PDF and ePub downloads, according to the available data) and Abstracts Views on Vision4Press platform.
Data correspond to usage on the plateform after 2015. The current usage metrics is available 48-96 hours after online publication and is updated daily on week days.
Initial download of the metrics may take a while.