Open Access
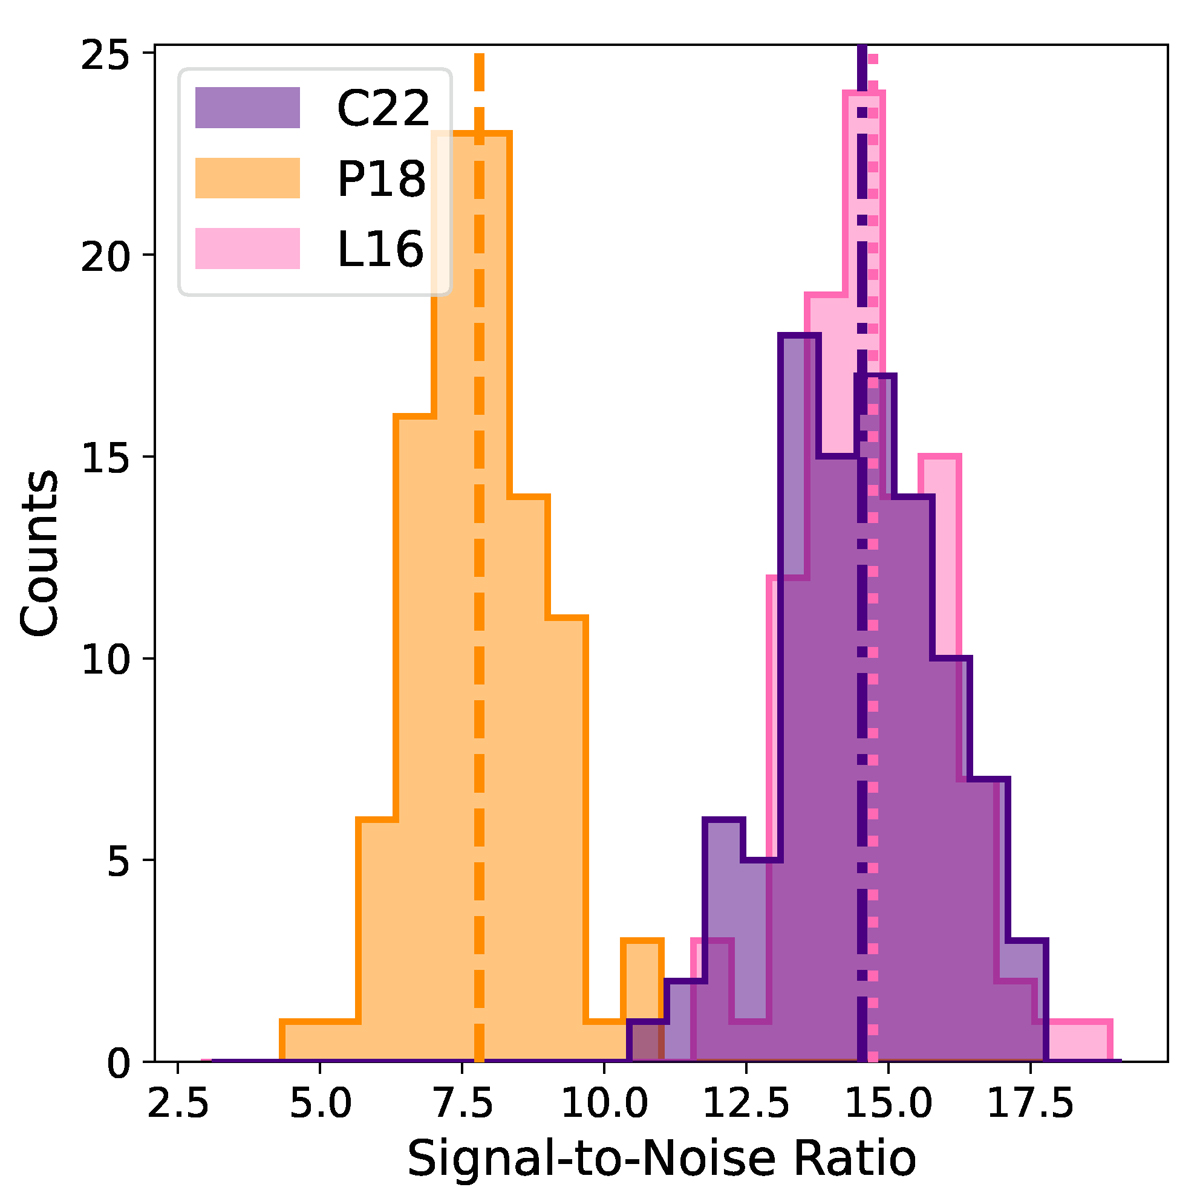
Fig. 15.
Download original image
Histograms of the output S/N ratio for each model of the CO luminosity of a DM halo as a function of its mass, L(Mh). Mean values for each model are shown as vertical lines. The three models are described in Section 2.2.
Current usage metrics show cumulative count of Article Views (full-text article views including HTML views, PDF and ePub downloads, according to the available data) and Abstracts Views on Vision4Press platform.
Data correspond to usage on the plateform after 2015. The current usage metrics is available 48-96 hours after online publication and is updated daily on week days.
Initial download of the metrics may take a while.