Fig. 17.
Download original image
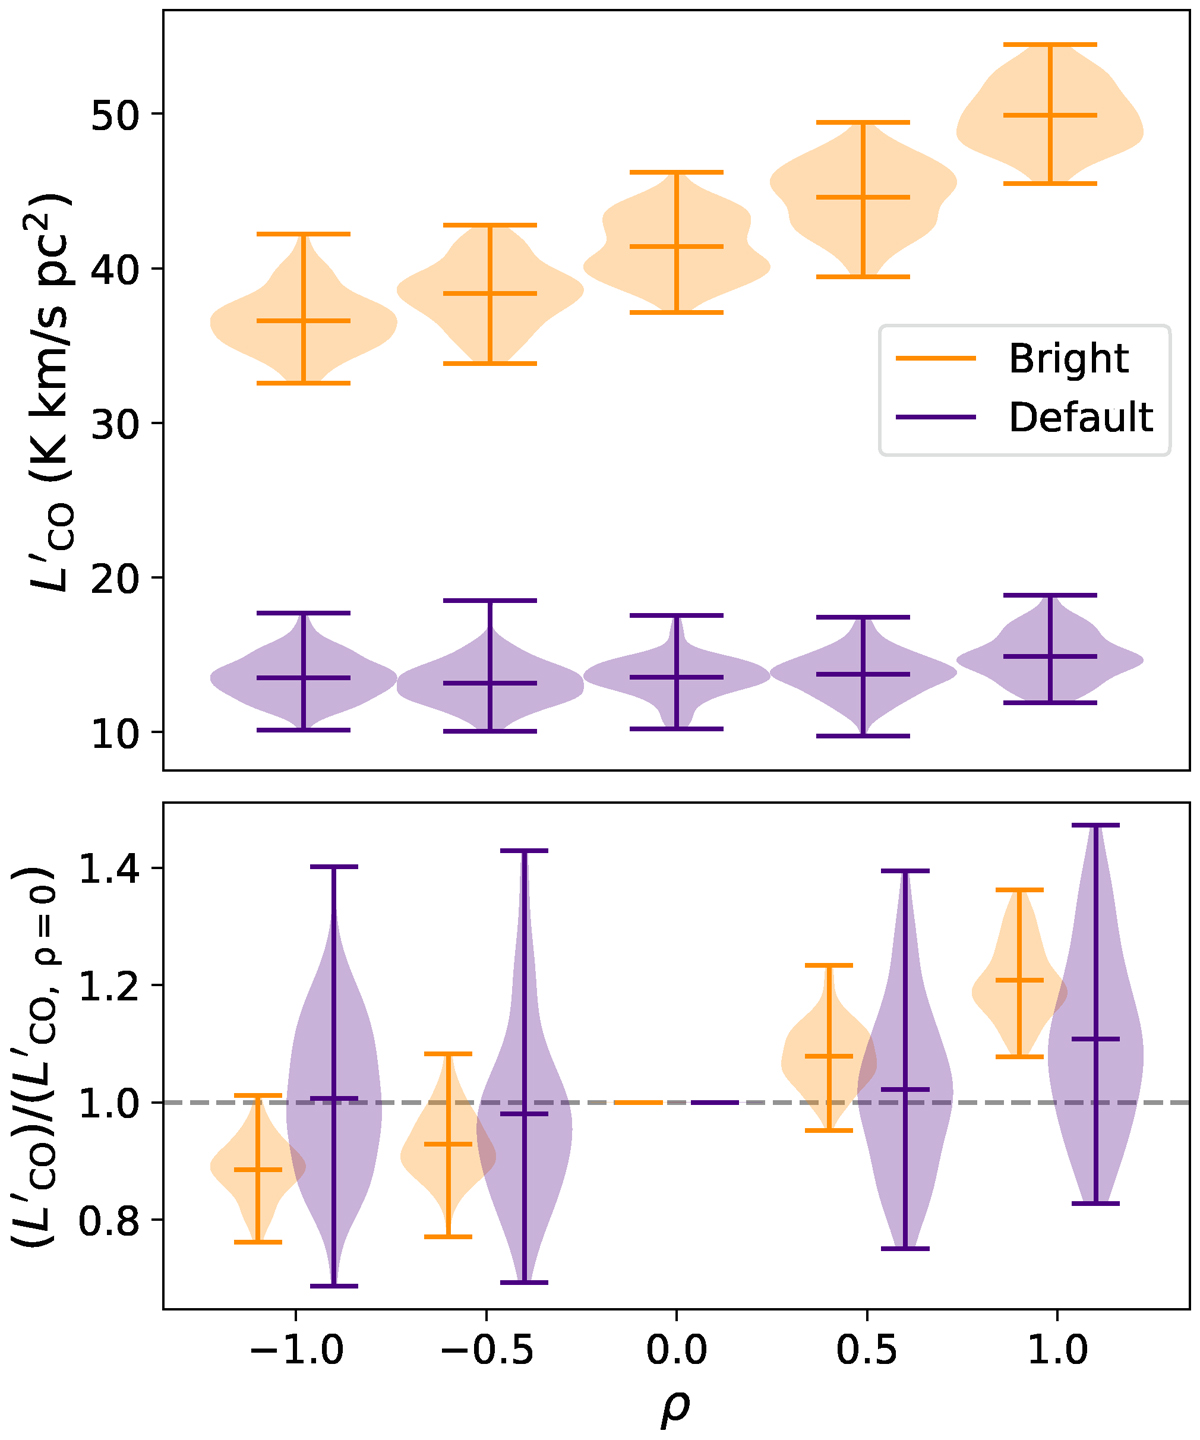
Effect of varying the correlation in the two luminosity values’ scatter on the output stack luminosity. Top: Violin plots showing the stack luminosity for each ρ value for both the default choice of the Lyα luminosity function z ∼ 3 and the bright AGN-like version. Bottom: Output luminosity values normalised to the value at ρ = 0 to show relative changes between values of ρ. Violins are offset slightly in the x-axis for clarity.
Current usage metrics show cumulative count of Article Views (full-text article views including HTML views, PDF and ePub downloads, according to the available data) and Abstracts Views on Vision4Press platform.
Data correspond to usage on the plateform after 2015. The current usage metrics is available 48-96 hours after online publication and is updated daily on week days.
Initial download of the metrics may take a while.