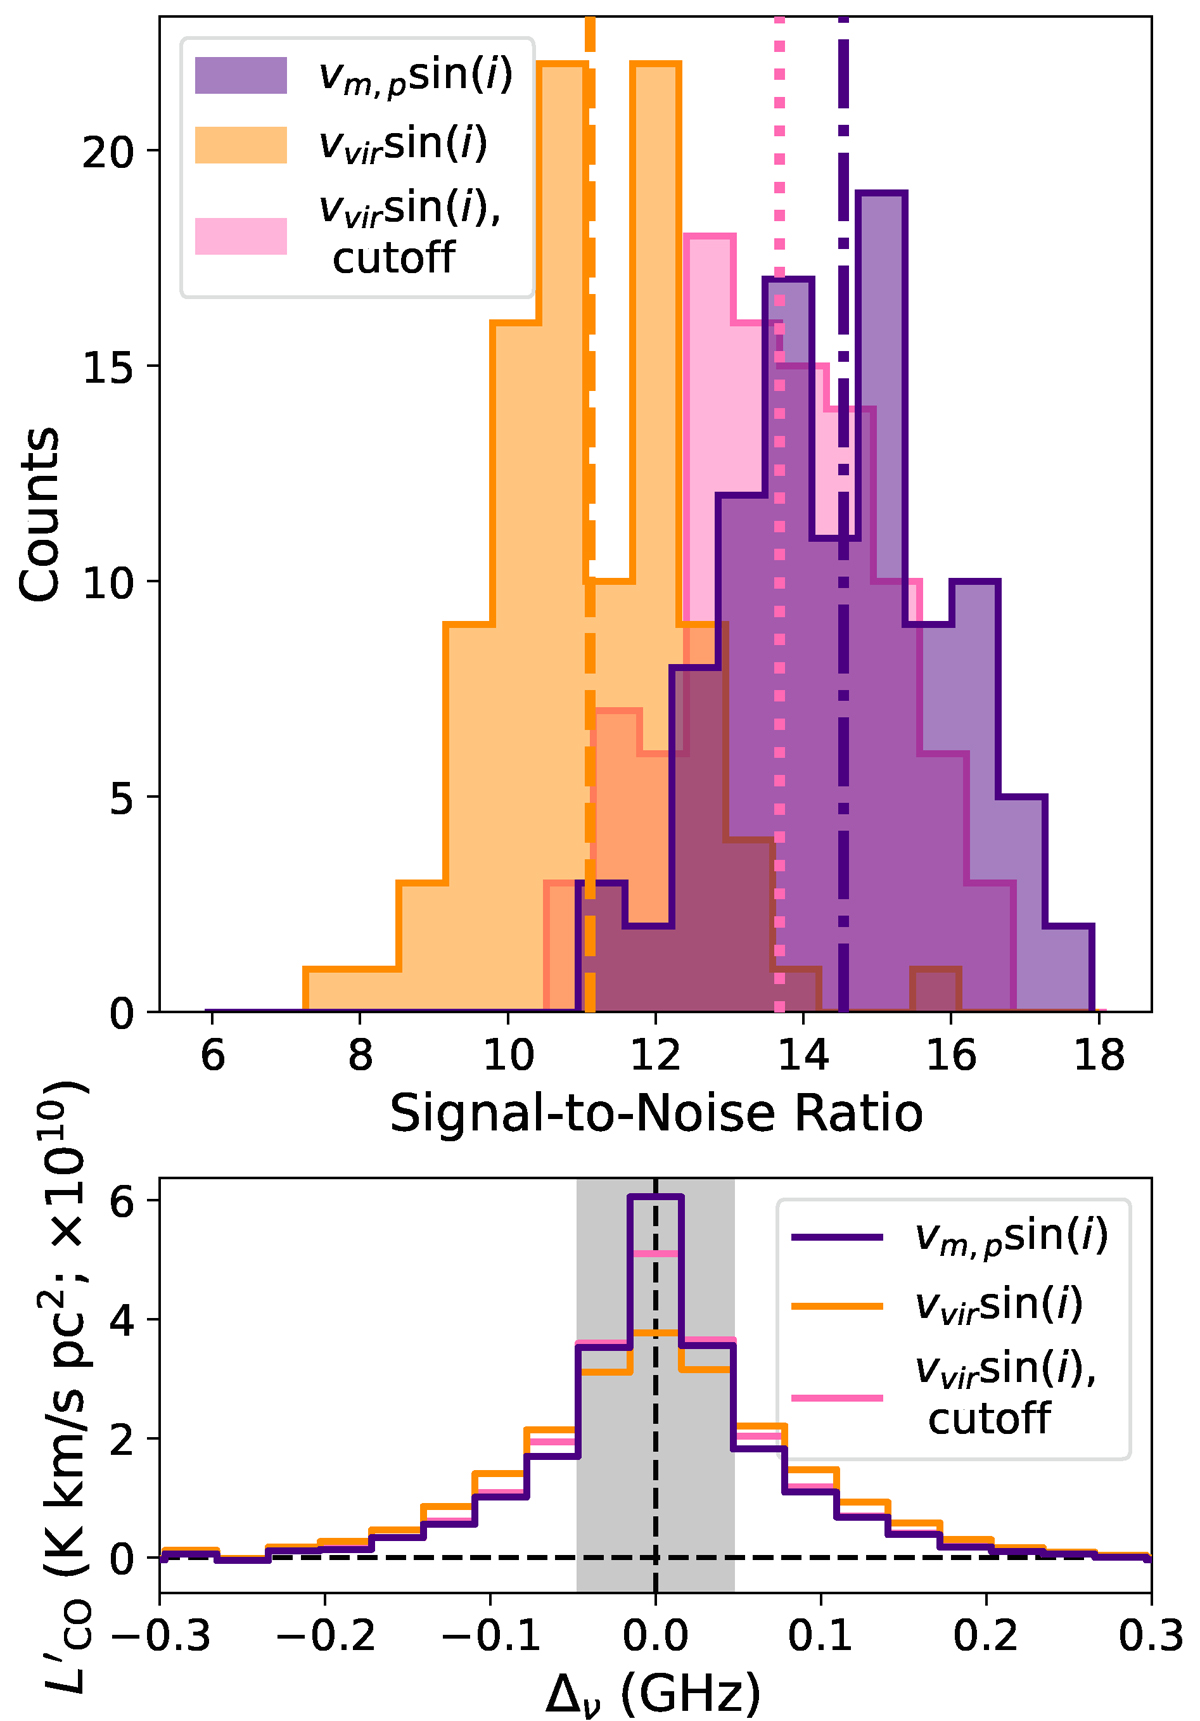
Fig. 18.
Download original image
Top: Histogram of the output S/N ratio for each prescription for astrophysical line broadening of CO. The different prescriptions are described in Section 2.5. Mean values are indicated with vertical lines. Bottom: Average stacked spectrum across simulation realisations for each prescription. The central 93.75 MHz, which is integrated across to determine the final stack luminosity, is shown in shaded grey.
Current usage metrics show cumulative count of Article Views (full-text article views including HTML views, PDF and ePub downloads, according to the available data) and Abstracts Views on Vision4Press platform.
Data correspond to usage on the plateform after 2015. The current usage metrics is available 48-96 hours after online publication and is updated daily on week days.
Initial download of the metrics may take a while.