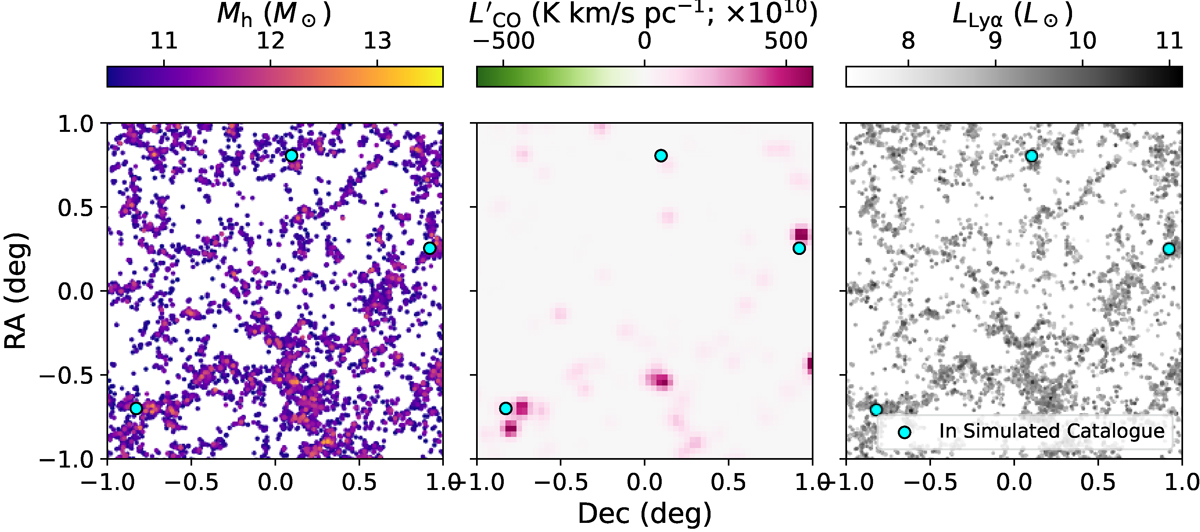
Fig. 2.
Download original image
Zoomed-in frequency slices of the simulated population of DM halos and resulting mock observations. Left: DM halos, coloured by their halo mass. Centre: Mock LIM fluctuation map of the CO emission (with no noise added). Right: Lyα luminosity of each DM halo. The halos that would actually be detected by the mock survey and thus included in the galaxy catalogue are shown as larger cyan circles in all three panels.
Current usage metrics show cumulative count of Article Views (full-text article views including HTML views, PDF and ePub downloads, according to the available data) and Abstracts Views on Vision4Press platform.
Data correspond to usage on the plateform after 2015. The current usage metrics is available 48-96 hours after online publication and is updated daily on week days.
Initial download of the metrics may take a while.