Open Access
Fig. 20.
Download original image
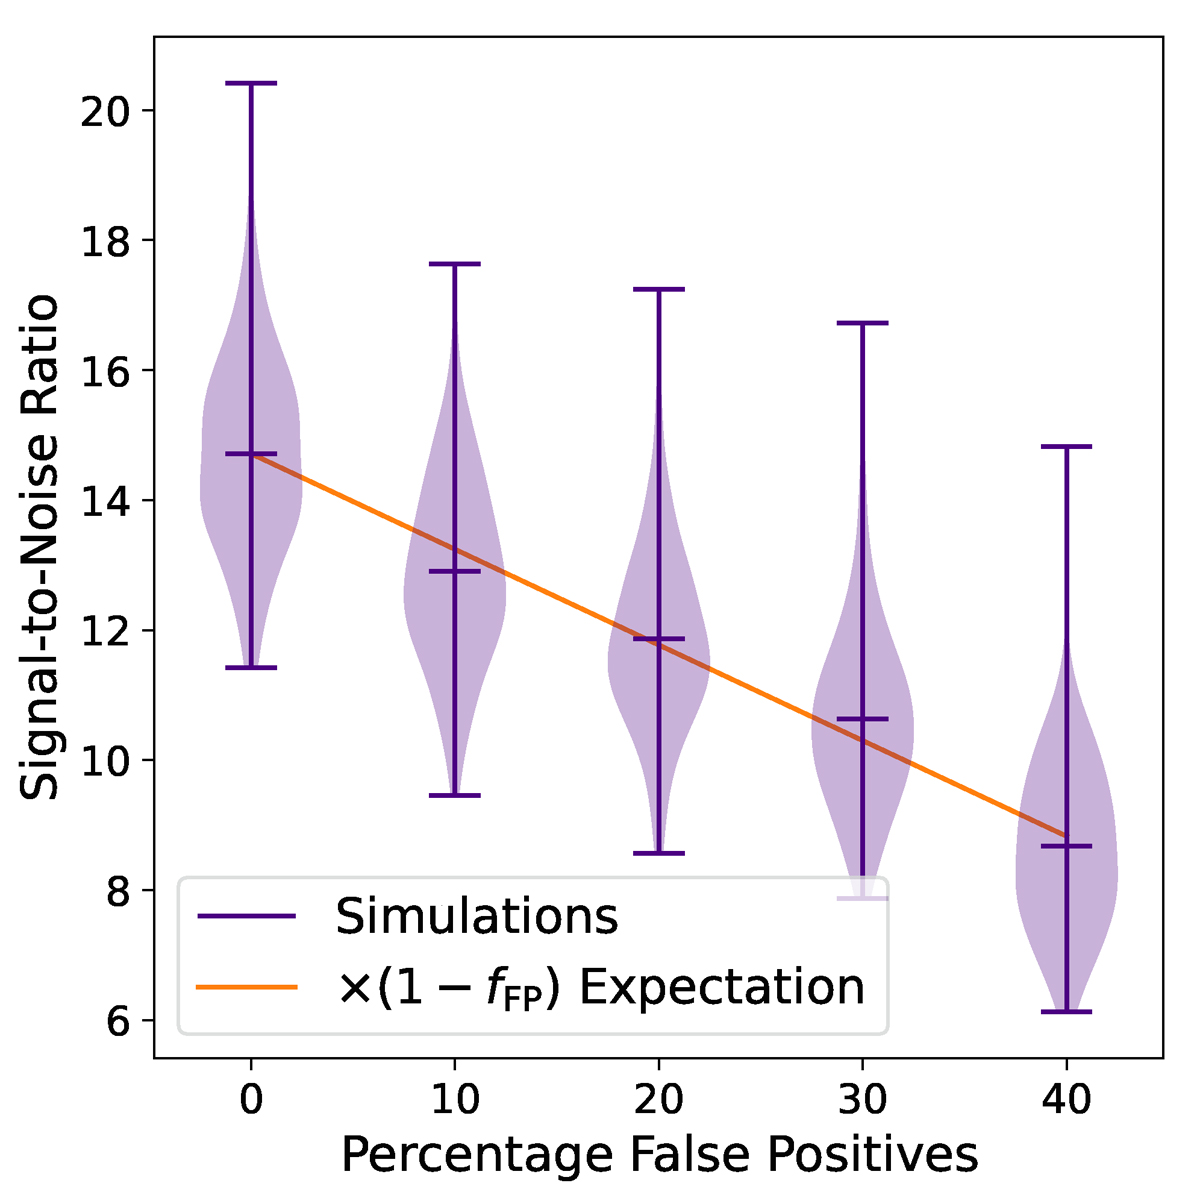
Signal-to-noise ratio of the stack as a function of the percentage of ‘false positive’ interlopers included in the galaxy catalogue. Plotted in orange is the theoretical expectation, assuming the value of the map is identically zero at the (random) location of each false positive.
Current usage metrics show cumulative count of Article Views (full-text article views including HTML views, PDF and ePub downloads, according to the available data) and Abstracts Views on Vision4Press platform.
Data correspond to usage on the plateform after 2015. The current usage metrics is available 48-96 hours after online publication and is updated daily on week days.
Initial download of the metrics may take a while.