Fig. 22.
Download original image
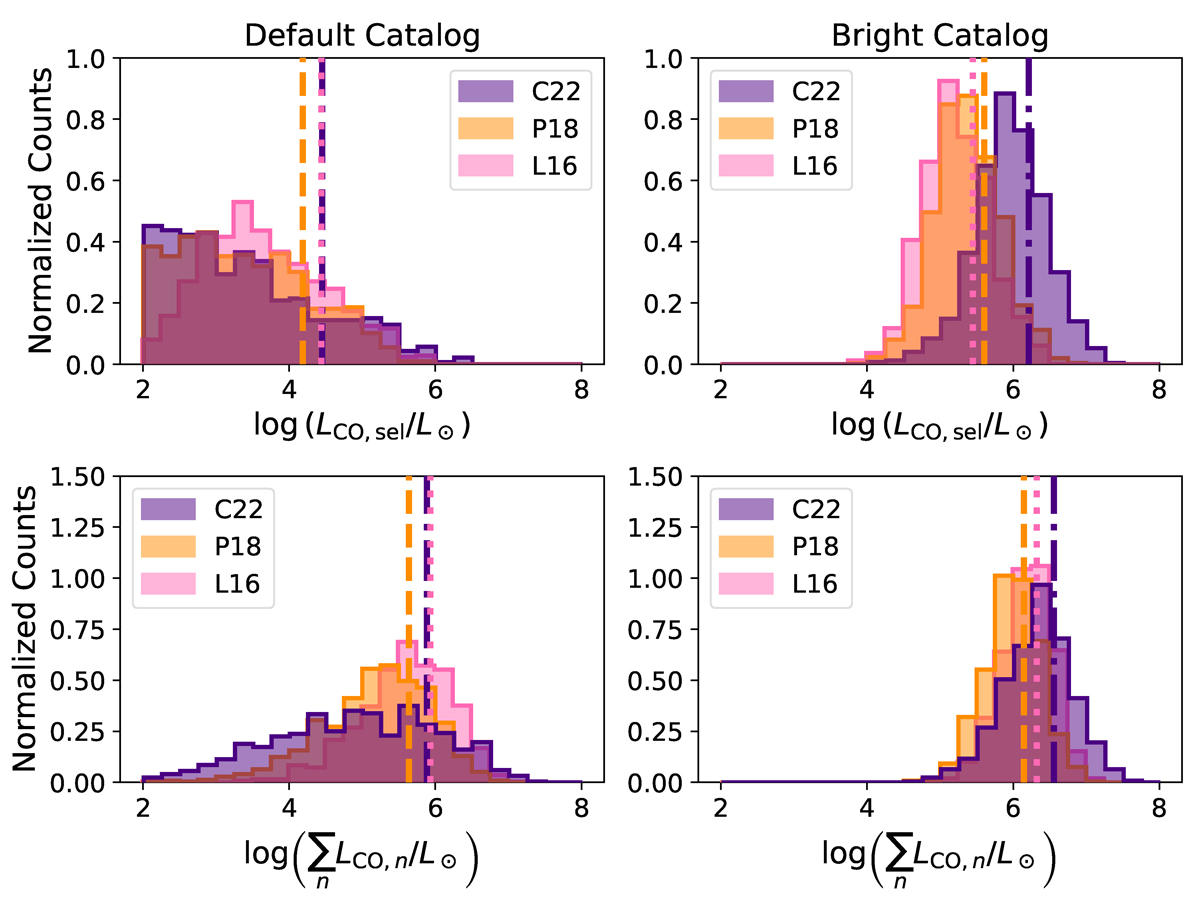
Comparison of the terms contributing to the overall stack luminosity for a single simulation realisation using the three different CO prescriptions. The top panel shows histograms of the LCO of each DM halo included in the galaxy catalogue and thus directly selected to be included in the stack. The bottom panel shows the summed LCO of all the halos neighbouring a given selected halo – these halos also fall into the stack aperture and thus contribute to the stack as well. In both panels, the (linear) averages are shown as vertical lines.
Current usage metrics show cumulative count of Article Views (full-text article views including HTML views, PDF and ePub downloads, according to the available data) and Abstracts Views on Vision4Press platform.
Data correspond to usage on the plateform after 2015. The current usage metrics is available 48-96 hours after online publication and is updated daily on week days.
Initial download of the metrics may take a while.